Wondering how to calculate your sample size? Find out how many people to survey for statistically significant and actionable results with our sample size calculator.
Once you’ve calculated your sample, start surveying for free.
Number of people in the entire population you want to analyze.
Percentage indicating how sure you are that the entire group would choose an answer in a given range. 95% is the most commonly used confidence level.
Percentage indicating how likely you believe the sample will deviate from the total population.
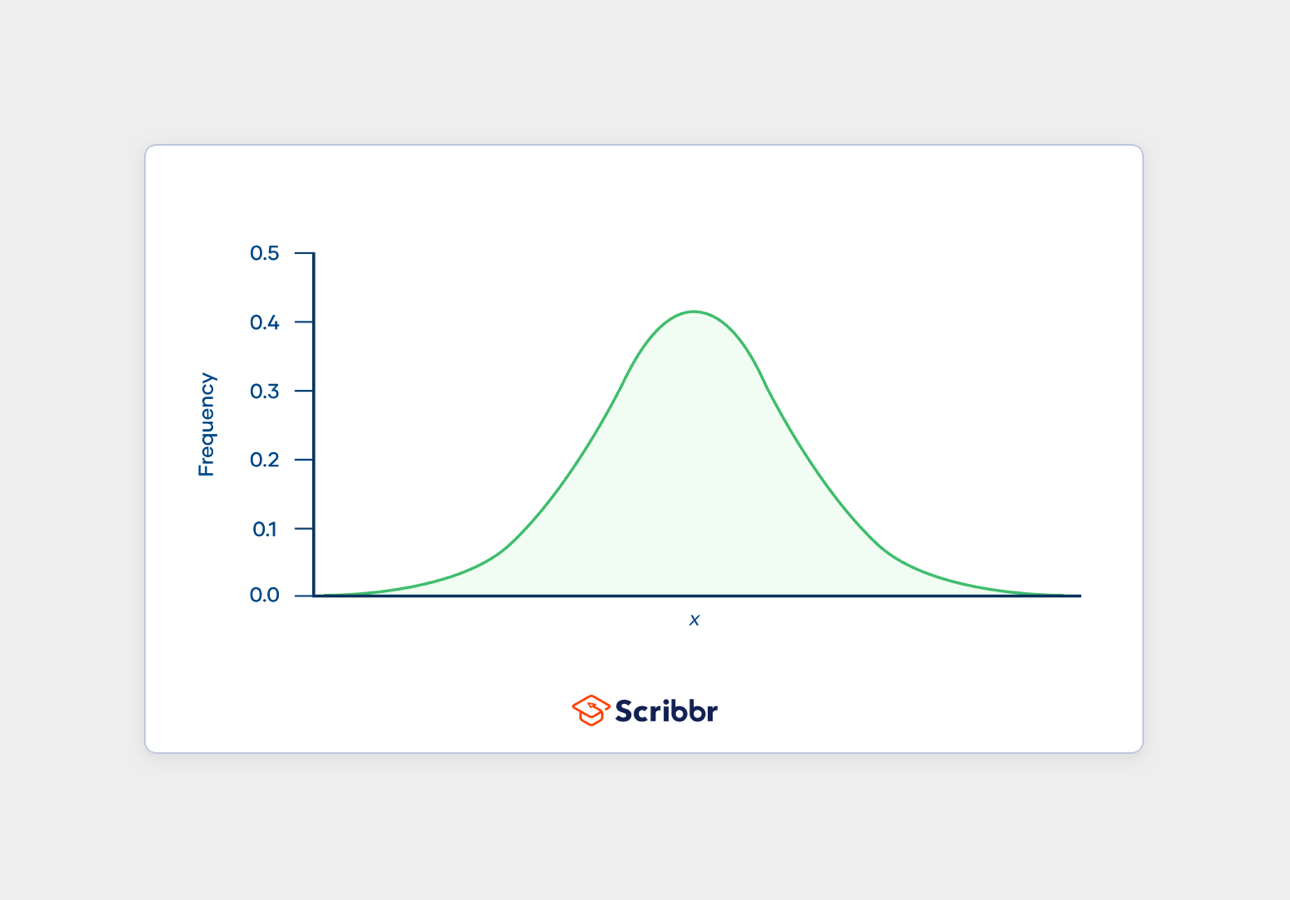
Sample size is a market research term used to define the number of subjects who completed your survey. This group of people – the target population – represents a part of the population you seek to analyze. Since it’s highly unlikely to get answers from the entire group, your sample size is the percentage of the population you’re surveying that represents the population in its entirety.
For example, in a study determining the purchasing habits of millennial customers, it would be impossible to survey all 72.9 million millennials in the US. However, if you take a random sample of 10,000 millennials out of the total 72.9 million, the sample size would be 10,000. But how do you determine the number of people you need in your sample? That’s where a minimum sample size calculator comes in handy.
When it comes to determining sample size, you can find out how many people to survey using a sample size calculator. You’ll need a few pieces of information to get started: margin of error, confidence level, and population size.
Margin of error is a plus-or-minus figure, usually expressed as a percentage, that represents how likely you believe the sample will deviate from the total population. The smaller the margin of error, the more likely your findings are to be accurate at your given confidence level.
Confidence level is a percentage indicating how sure you are that the entire group would choose an answer in a given range. A high confidence level means that you’re almost positive that respondents will answer within a given range. 95% is the most commonly used confidence level.
Population size is the number of people in the whole group or the entire population you want to analyze. For example, if you have 10,000 customers in your entire database, that number would be your population size, which you would use to calculate your sample size.
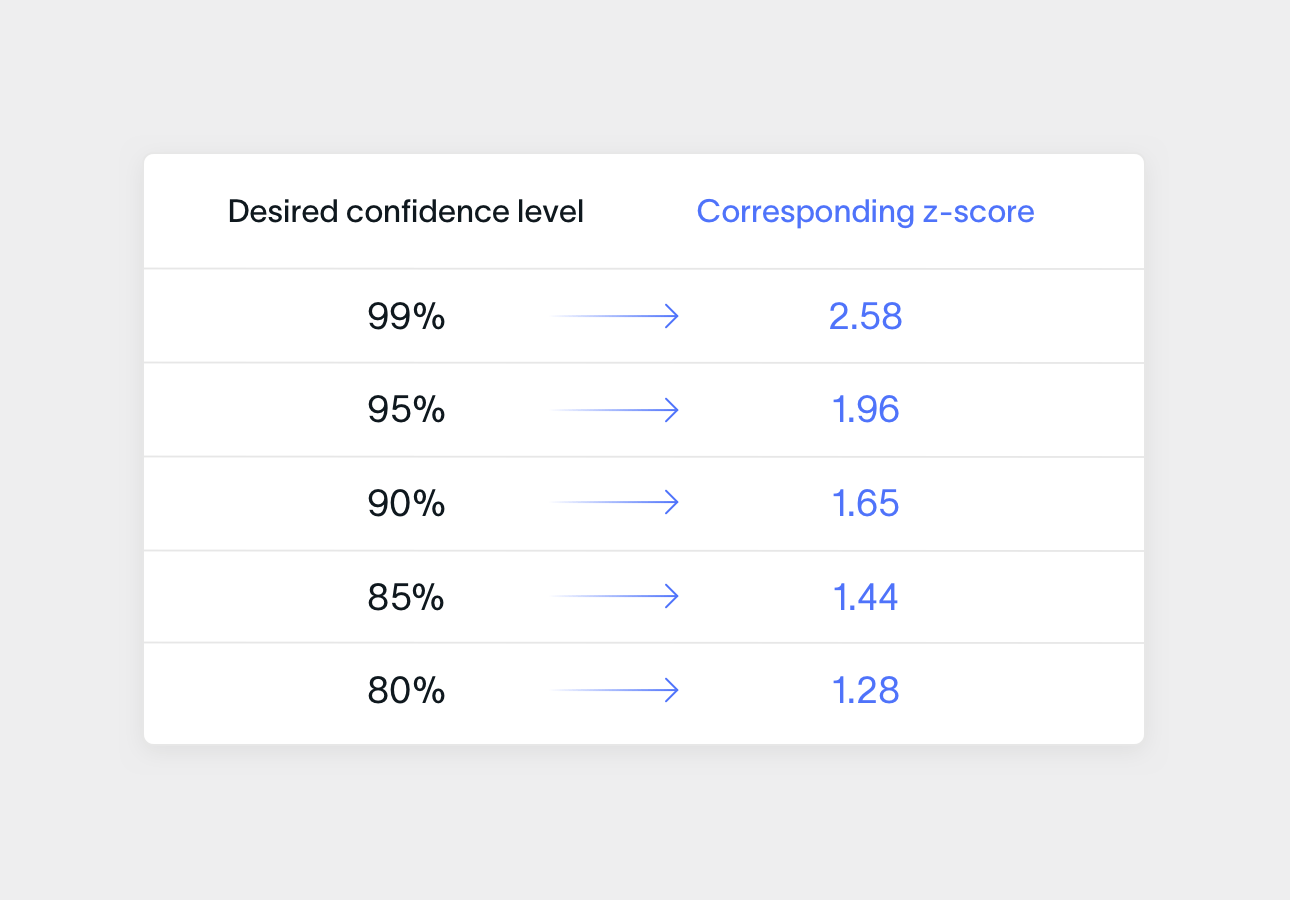
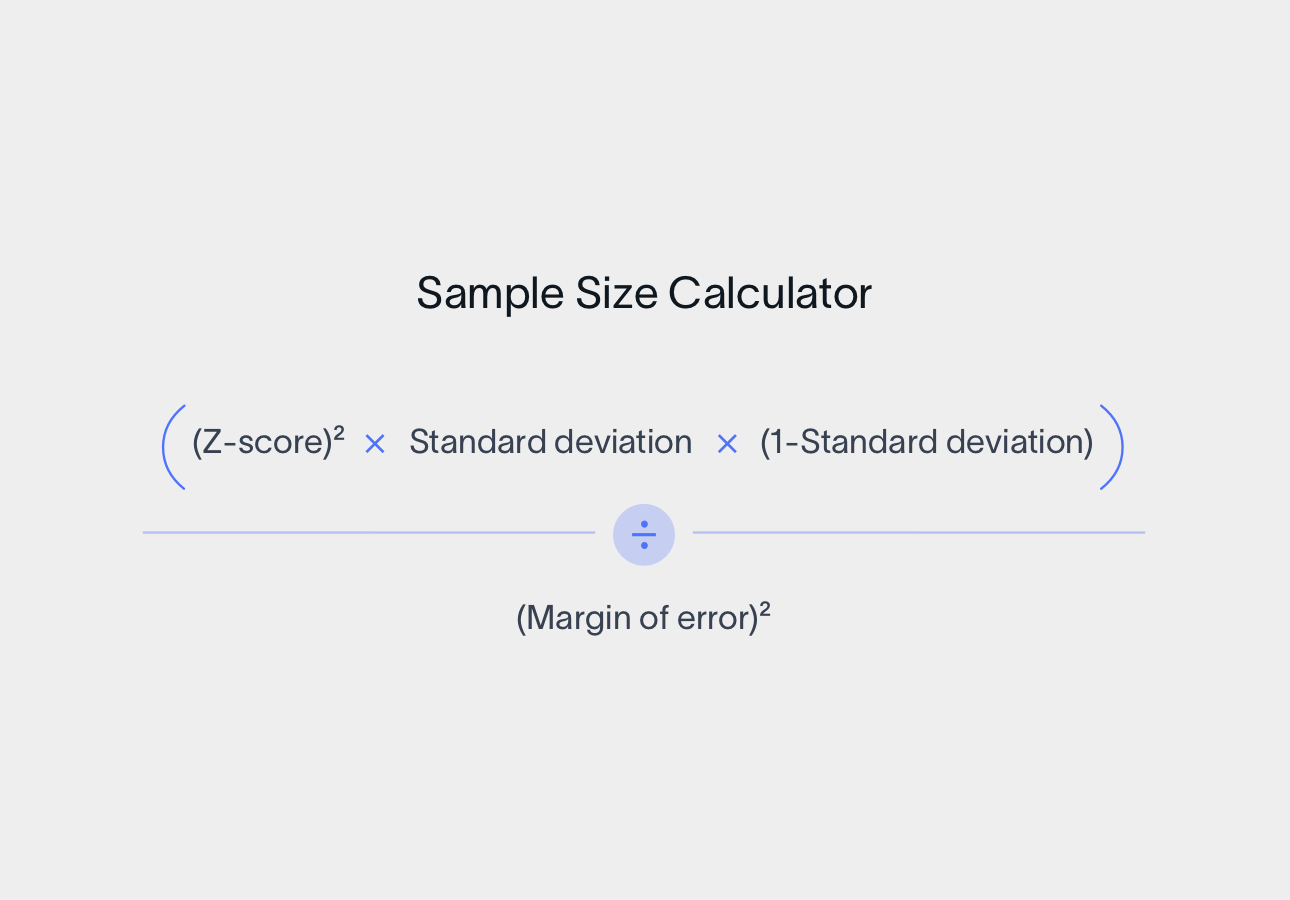
Another way to find your sample size is to calculate it manually using the sample size formula. To use the formula, you’ll need two additional pieces of information: your z-score and standard deviation.
Your z-score is the numerical version of your confidence level and shows how many standard deviations your score is from the mean. The most commonly used percentages for z-scores are 90%, 95%, and 99%. Unsure which z-score you should use? Choose one from the table below based on your desired confidence level.
Standard deviation is how much each response varies from one another and the mean. A low standard deviation means less variability in your results, while a high standard deviation means more variability. For example, 0.5 is a good standard deviation which shows that your sample size reflects the sentiment of the entire group.
Sample size formula
Now that you have your z-score and standard deviation, you can plug those values into the sample size formula below, along with your margin of error. After that, you’ll have the sample size you need to survey. Feel free to check your work with the calculator above!
Now that you have your ideal sample size calculation, keep these best practices in mind as you begin surveying your sample.
If you prefer a smaller margin of error or a higher confidence level, consider increasing your sample size given the population. That way, your sample will more accurately represent the entire population since you have more data to base your findings on.
Statistical significance is a number indicating whether or not your survey findings are coincidental. If your results are statistically significant, your findings (i.e., your product update did increase your PMF score) can be replicated if you were to run the survey again with a different sample.
You don’t always need statistically significant results – all feedback can be used to improve experiences. However, statistically significant results can help you be more confident about your survey data and therefore, more confident in your decision to act on the findings.
Consider adding open-ended questions to your surveys to gather qualitative or nonnumerical survey data. Including free-response questions in your survey allow respondents to explain their answers to close-ended questions in their own words.
Open-ended questions in customer feedback surveys allow customers to get granular about specific aspects of the customer experience and provide examples of how to meet their expectations. The most impactful surveys combine both open and close-ended questions.
Once you have your ideal sample size, you’re ready to start surveying – but what type of survey should you send to your sample? This ultimately depends on the type of data you’re looking to collect from your survey respondents.
Measure customer loyalty with NPS surveys, or assess customer satisfaction and effort with CSAT and CES surveys. Capture customer sentiment quickly with visually intuitive surveys like 5-star, Thumbs, or Smiley face surveys. Gathering and tracking customer experience data over time prevents churn and supports long-term business growth.
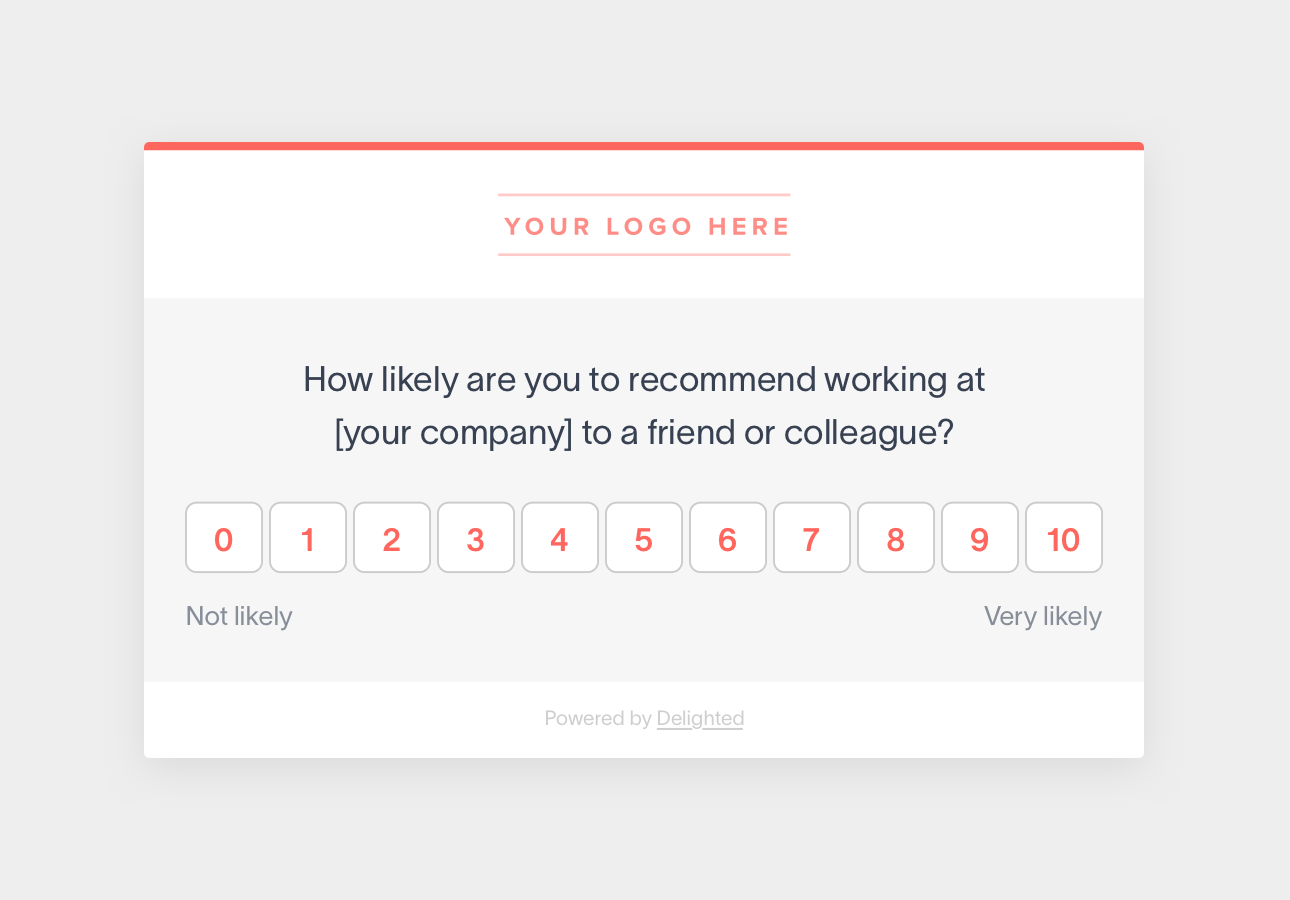
Send out recurring employee Net Promoter Score (eNPS) surveys to keep a steady pulse on how employees feel about the workplace and improve the overall employee experience. Remember to follow up the eNPS score question with a free-response question so employees provide actionable insights for your company to improve on.
Product feedback
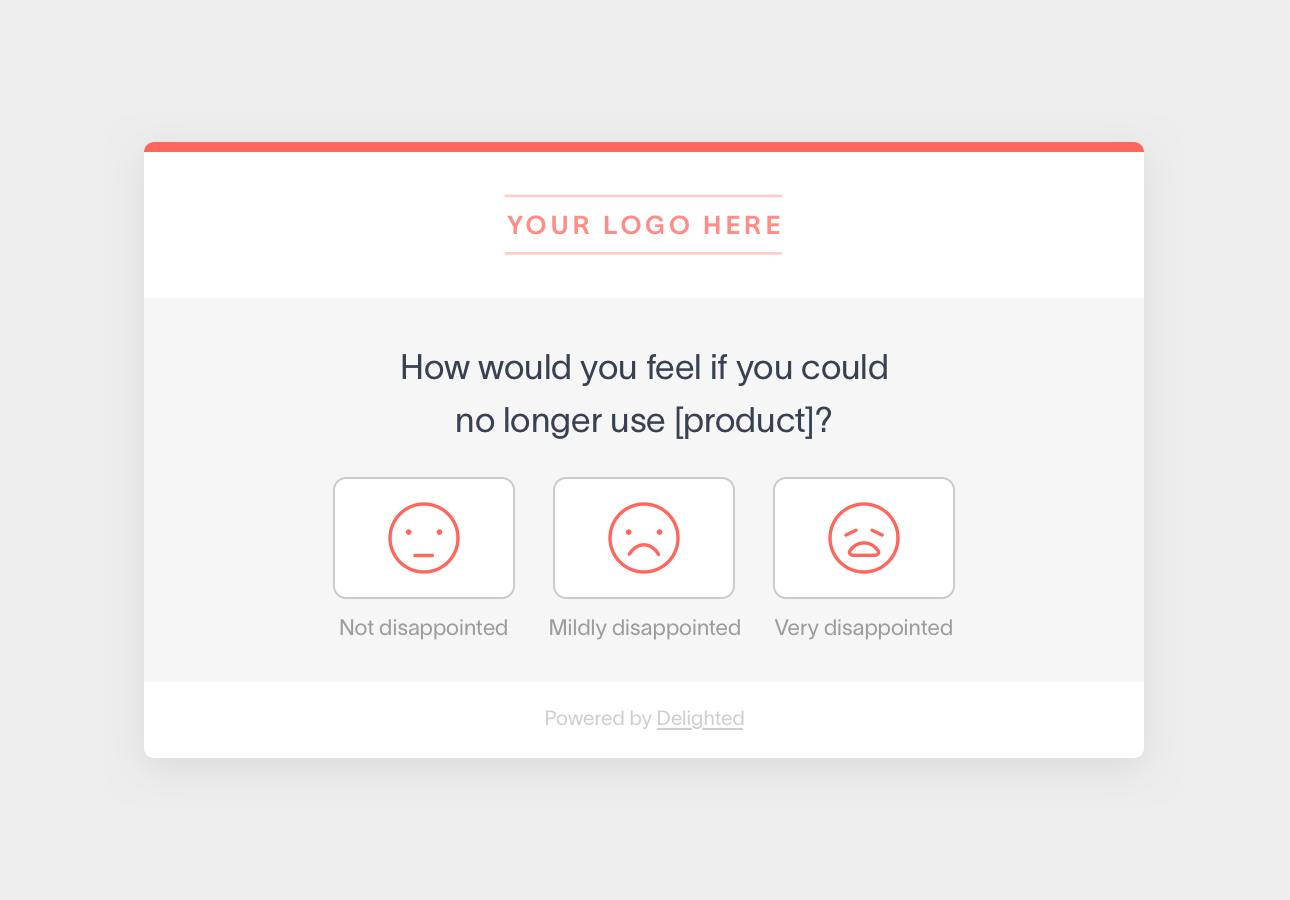
Understand if your product meets the needs and expectations of your audience with Product/Market Fit (PMF) surveys. Measuring your product/market fit and collecting feedback on product experience provides valuable insights you can use to build and adjust your future product roadmap and product positioning.