Net Promoter Score (NPS) is a key indicator of customer satisfaction, as well as a strong predictor of future growth. To improve your customer experience (CX), having the right tools to get you the information you need about the people who shop with you is essential.
Whether you’re a B2B or B2C company, relevance and longevity in your industry depend on how well your products answer the needs of your customers. However, when the time comes for you to demonstrate that understanding — during a sales conversation, customer service interaction, or through the product itself — how do you think you measure up?
In a previous post on biased survey questions, we went through how bad survey questions (e.g. leading or double-barreled questions) can negatively impact your survey results. In this post, we’ll be diving into the other major cause of misleading survey data: survey bias.
First, let’s define bias as a whole: bias is defined as “an inclination of temperament or outlook.” The concept comes up frequently in sociology and psychology, because it’s associated with prejudice or favoritism. But how does bias show up in surveys?
You’ve decided to send surveys to your customers, collect feedback, and use those insights to improve your business. But knowing what you want feedback on is only part of the battle. Survey success also depends on choosing the right types of survey questions to get the insights you need.
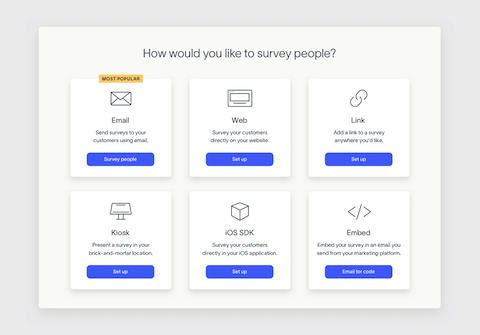
In this post, we’ll break down the 8 types of survey questions and response options, the pros and cons of each, as well as our tips for writing good survey questions.
Close-ended questions, or closed-ended questions, are a quantitative data collection method that require customers to choose from a list of answer options. Those answers can then be tallied into scores, percentages, or statistics that are tracked over time.
With close-ended survey questions, respondents are less likely to overthink their answers because they are given fewer options. Data from close-ended questions is also easier to collect and compare.
Close-ended questions work best when you have a good grasp of the exact topics you want feedback on and would like data that can be easily segmented for ongoing reports.
Multiple choice questions
Multiple choice questions might bring you back to grade school standardized testing – those timed tests that left you sweating while you frantically filled in the bubbles. In the context of a customer survey, these questions are much simpler for your customers to answer – that is, if you’ve provided a thoughtful, comprehensive set of responses.
To make things easier on your customers, you can also give them the option to select one or more options. Multiple choice questions are a great way to gather extra information to help you make new product decisions, understand where you can improve, or decide where to advertise to reach your audience.
Multiple choice question pros
Customers can choose one or multiple answers
Results can be compiled and analyzed easily for insight
Removes subjectivity from the answers
Multiple choice question cons
Limits answers to the ones you’ve provided
Leaves out the reason why
Can be time-consuming to create
Multiple choice question tips
Should consist of at least three different options
Include an “other” response option in case none of the choices fit
Answer options should be mutually exclusive
Answers should all be plausible and simply phrased
Multiple choice question examples
How can we do better?Answers could be options for new or improved product features or service offerings
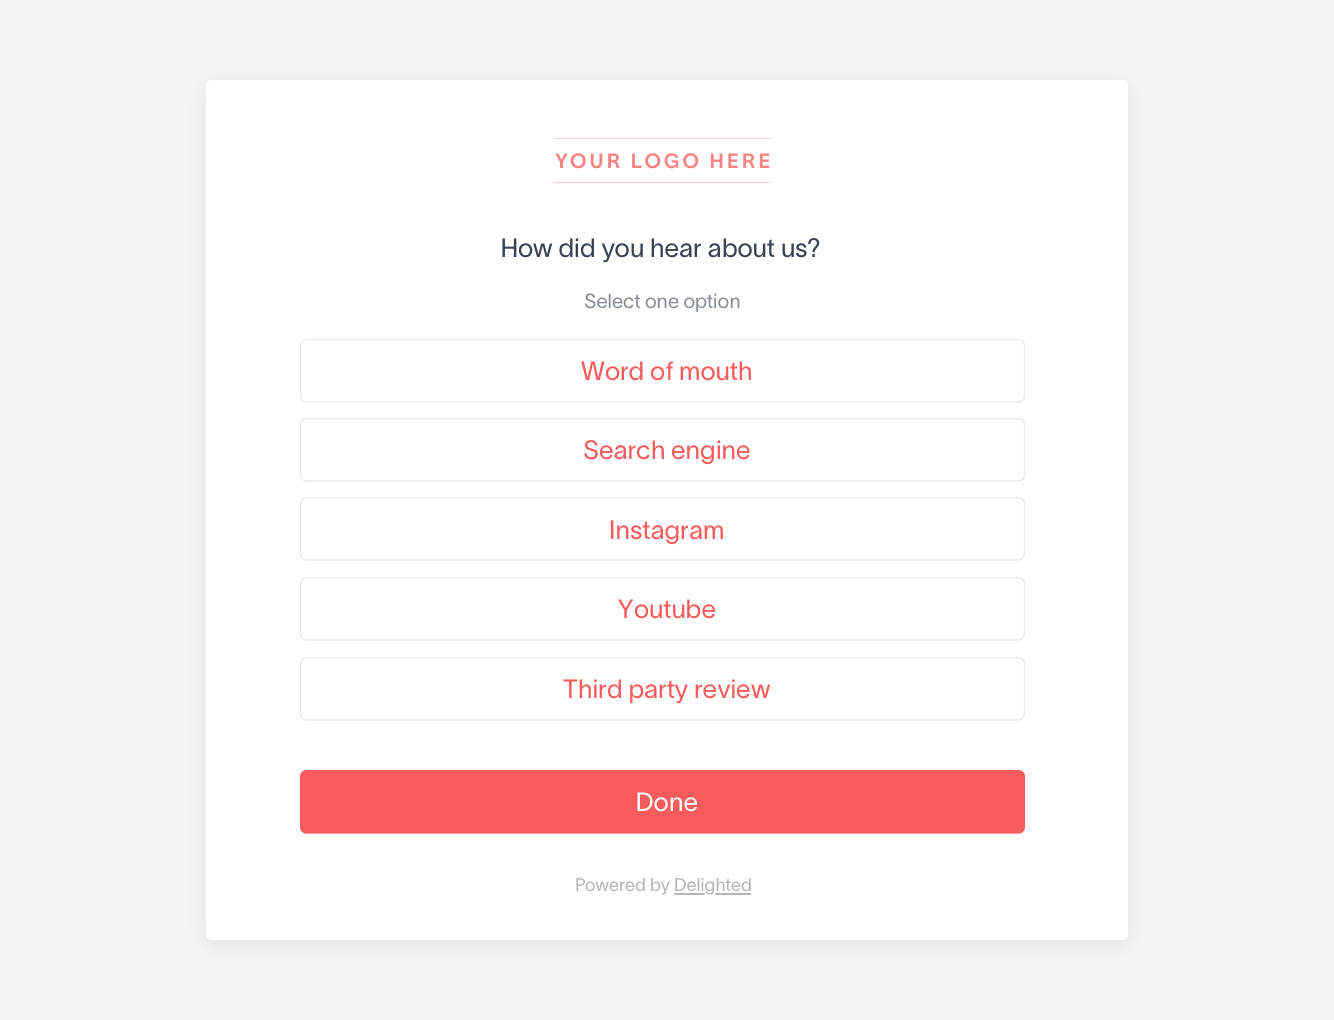
How did you hear about us? Answers could include social media, TV, newspaper, magazine, [Company] website, or word-of-mouth
Rating scale questions
A rating scale is one of the most well-known survey options. It allows folks to indicate what they think about a statement or attitude on a 5 or 7-point scale. You can set up rating scales with either a bipolar or unipolar construct.
Bipolar means the scale runs from negative to positive, with a neutral rating in the middle. For example, a bipolar scale could go from “strongly disagree” to “strongly agree,” with “neither disagree nor agree” in the center of the scale.
A unipolar scale ranges from zero to positive, and is used when a negative rating wouldn’t make sense semantically. For instance, the star rating question, “How would you rate your experience” wouldn’t have an option for negative stars, and would be a unipolar scale. A question rated along the lines of “effectiveness” would also be unipolar, since it’s impossible for something to be “negative effective.” It can only be “ineffective.”
Rating scale question pros
Flexibility in creating the rating scale
Can be used to evaluate any part of the customer experience
Provides a statistic that is easily tracked over time
Rating scale question cons
Doesn’t dig into why customers choose a specific rating
Requires some preparation to determine which facets of the business are most important to ask about
Rating scale question tips
Use a balanced scale with equal positive and negative responses
Include a neutral response for those without strong feelings either way
Use this scale to find out what customers think or feel about products, services, websites, advertising, or other aspects of your business
Rating scale question examples
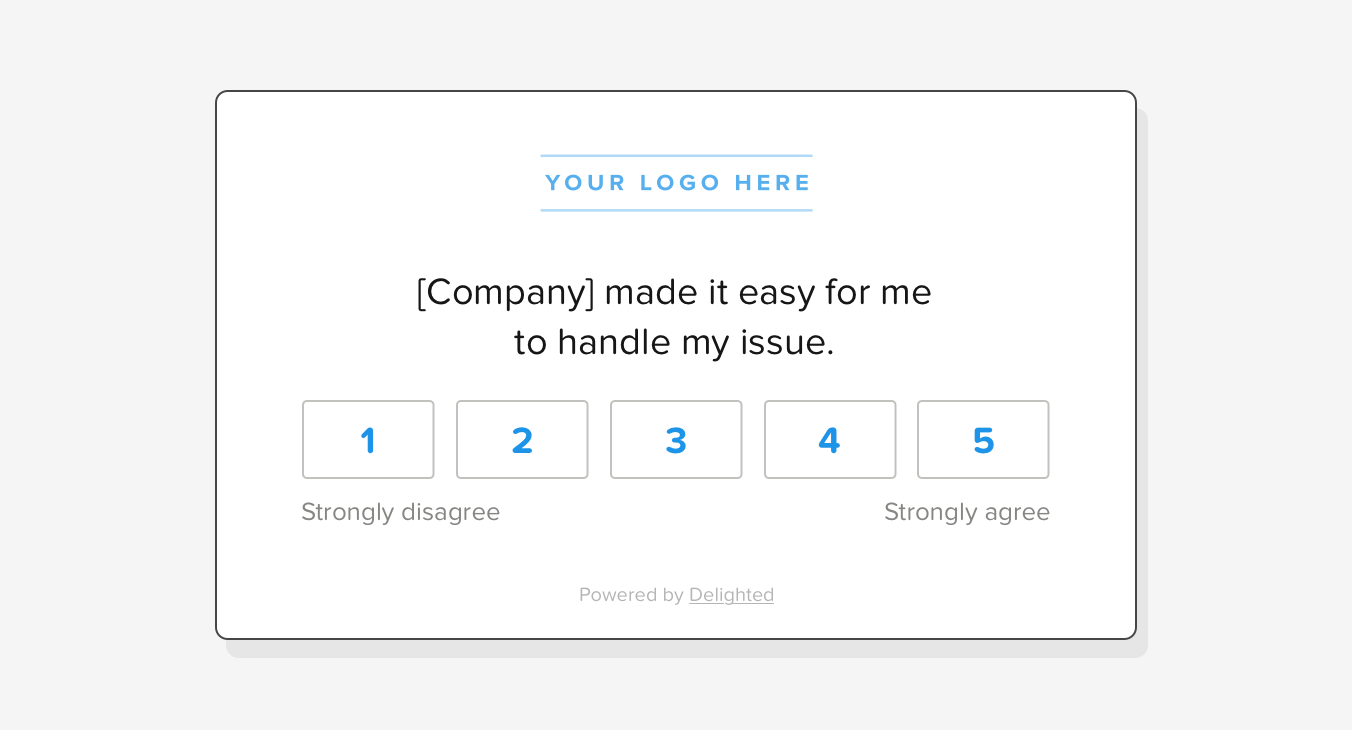
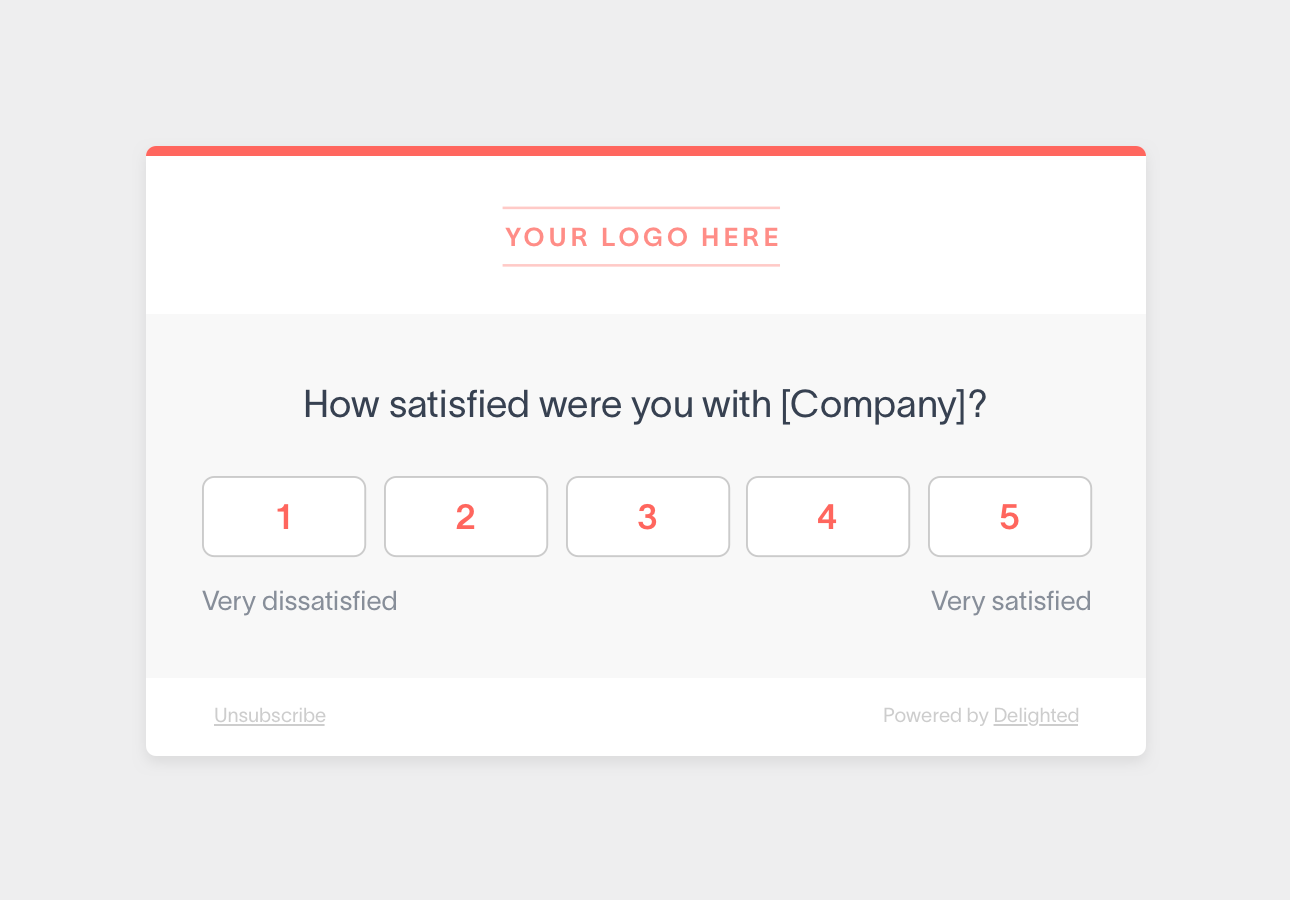
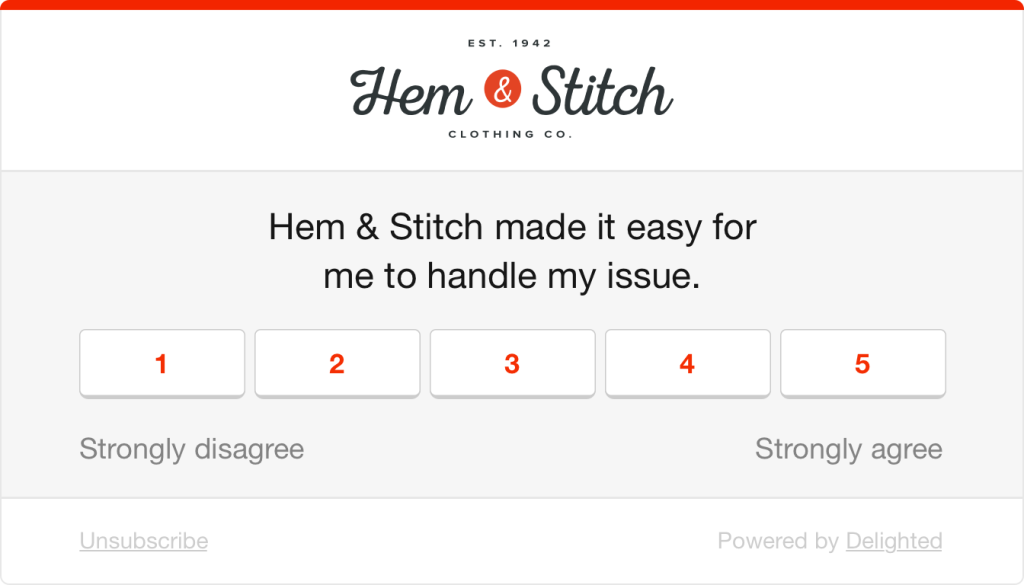
The Customer Effort Score (CES) survey is a great example of a rating scale survey. Customers respond on a scale of 1 to 5 on how strongly they agree with the statement, with 5 indicating “strongly agree”. This type of disagree-agree scale is also known as a Likert scale.
[Company website] made it easy for me to handle my issue. The answers here would be:
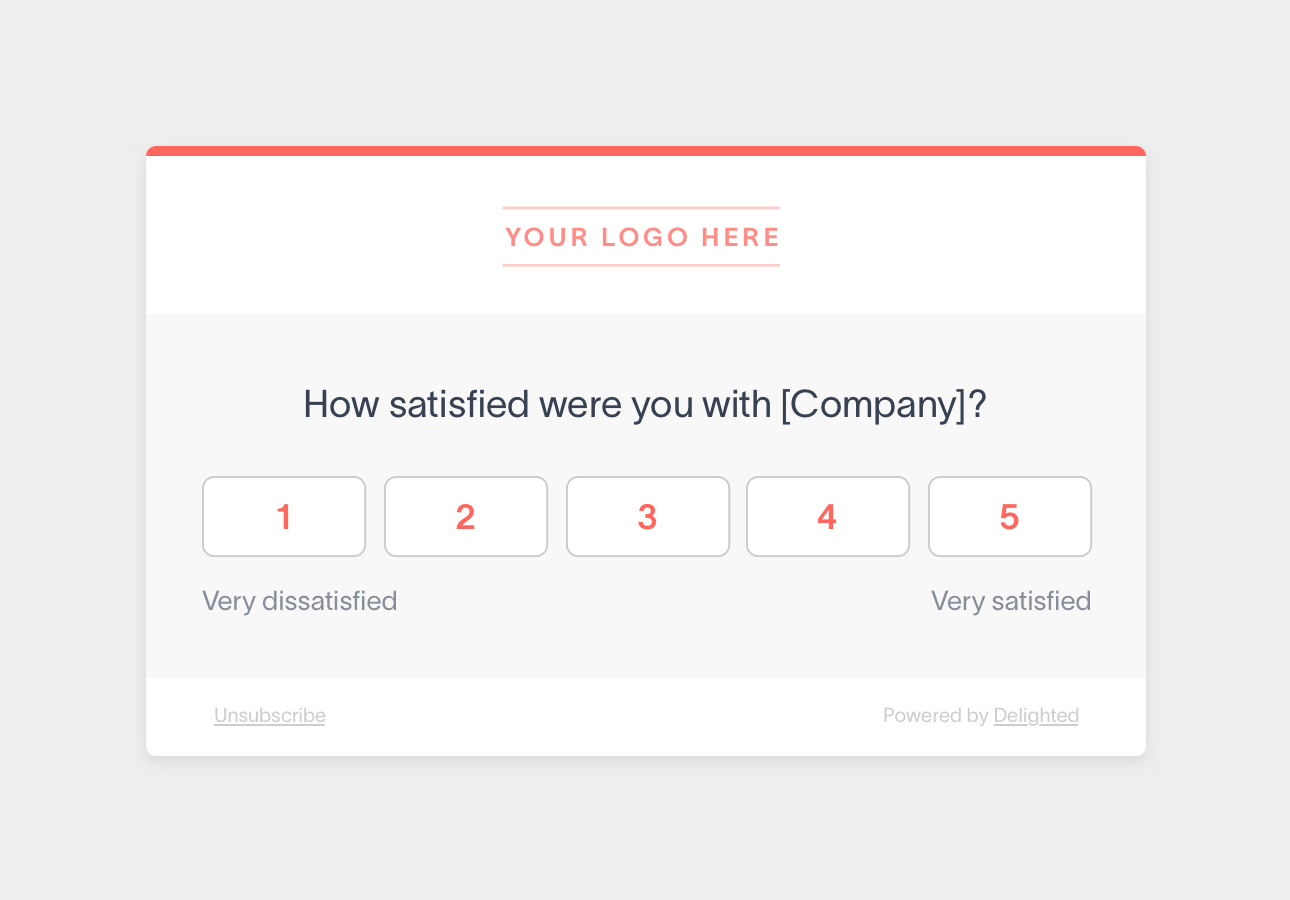
How satisfied were you with [Company/aspect of the customer experience]? The answers here would be:
1: Very dissatisfied
2: Slightly dissatisfied
3: Neutral
4: Satisfied
5: Very satisfied
CES surveys measure how easy it is for customers to accomplish their goal, while CSAT surveys measure satisfaction. Both questions can be modified to evaluate customer sentiment about specific customer touchpoints.
For example, you could create custom follow-up questions after a customer support CSAT survey to ask for ratings on staff product knowledge, helpfulness, courteousness, and problem resolution. For more ideas on what to ask, here’s a full list of customer satisfaction survey question examples.
Dichotomous questions
A dichotomous survey is a question with only two possible answers: yes/no, true/false, or agree/disagree. Designed for fast, easy responses, dichotomous survey questions enable straightforward evaluations. They also work well as screening questions.
For example, you could ask your customers whether they’re aware of a certain product feature, and then dive deeper with a different set of questions depending on how they answer. In survey design, this is called conditional logic – only asking specific, additional questions if they apply.
Dichotomous question pros
Simple and quick to answer
Results are easy to understand at a glance
Allows you to divide customers into two different groups
Dichotomous question cons
Doesn’t allow for higher sensitivity
Forces a yes/no answer when more information may be needed
Doesn’t have a neutral option for those who don’t feel strongly one way or the other
Dichotomous question tip
Always phrase the question for a yes/no answer
Dichotomous question examples
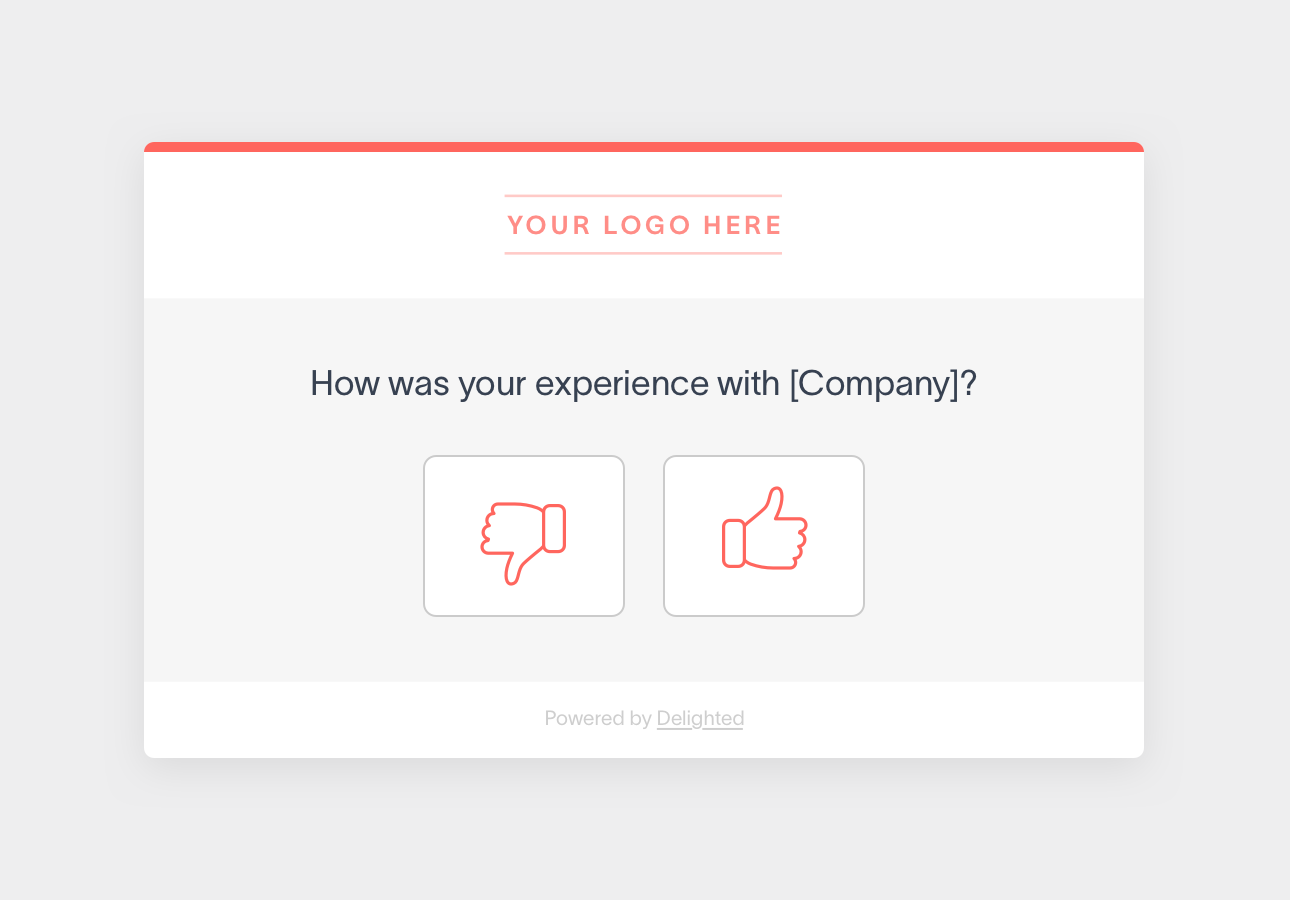
How was your experience with [Company]?
Was your customer support issue resolved?
Have you purchased/used [Company’s] product or service in the last 30 days?
Have you ever used [Company] website to purchase a product or service?
Thumbs surveys include a dichotomous survey question. Instead of selecting yes or no, however, customers choose a thumbs up or thumbs down. When used as the initial question, it is always followed by an open-ended question so customers can provide an explanation behind their answer.
Visual scale questions
Visual scale surveys make it easy for respondents to select a rating because they elicit an intuitive response.
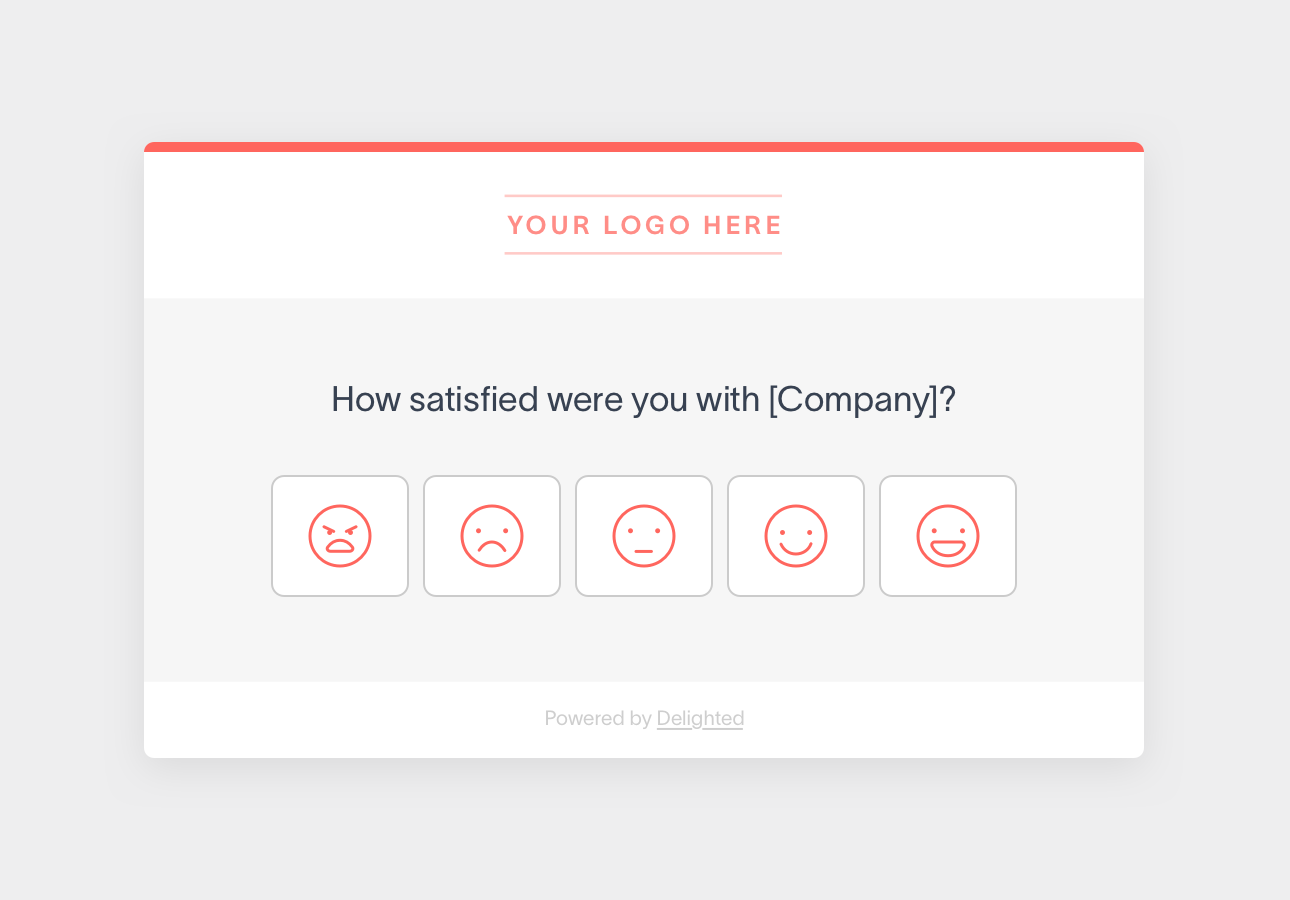
The smiley scale is well known in hospital rooms under the “rate your pain” question, with the crying face signifying intense pain and the smiley face signifying the least amount of pain. It is easier for someone to select an option when they can place an emotion behind it.
Visual scale question pros
Easy to react to
Visually appealing
Transcends language barriers
Increases responses and engagement
Visual scale question con
Can only be used for satisfaction-style questions
Visual scale question tips
Do not explain the scale, which counters the intuitive nature of the scale
Be sure that the question is phrased in a way that fits the context of a smiley face scale
Visual scale question example
How happy are you with the [Company’s] product or service?
Smiley face surveys are a fun and engaging way to gather product and customer support feedback. Follow up with an open-ended question for more details.
Net Promoter Score (NPS) survey questions
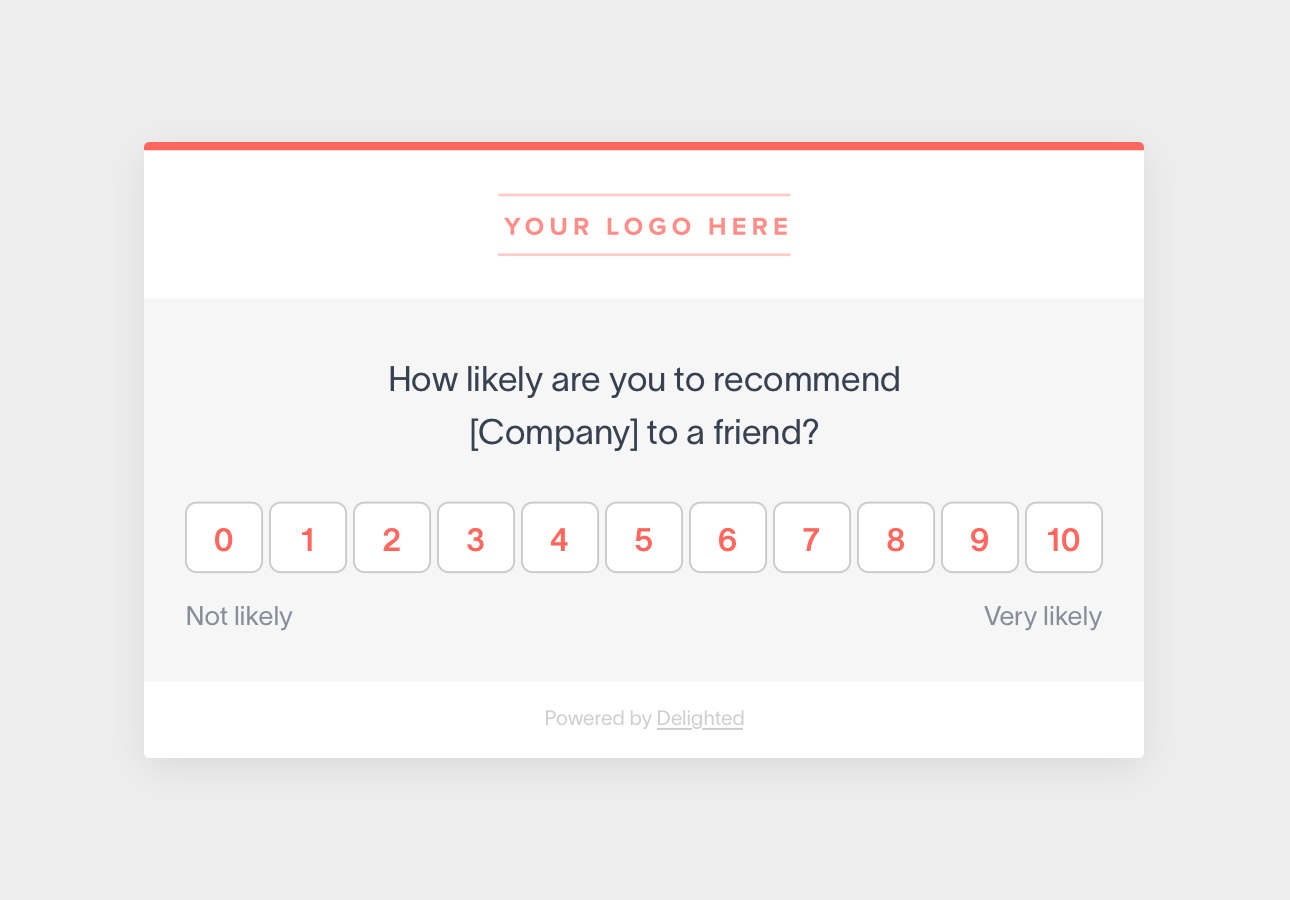
Net Promoter Score (NPS) surveys not only measure customer satisfaction, but also indicate brand loyalty. The NPS question assesses the likelihood that someone will recommend your company to friends or family.
Even though the question includes a 0 to 10 scale, we set it apart from a traditional rating scale survey because of how the responses are scored.
Responses are sorted into detractors, passives, and promoters. Detractors are those who rate you 0 to 6, and are the least satisfied with your business. Passives are in between with a 7 or 8 score. Promoters give you the highest score with a 9 or 10 and are your most loyal customers.
To find your NPS score, manually subtract the percentage of detractors from the percentage of promoters. Or, you can calculate your score automatically using an NPS calculator. Then, track your score over time using an NPS tool.
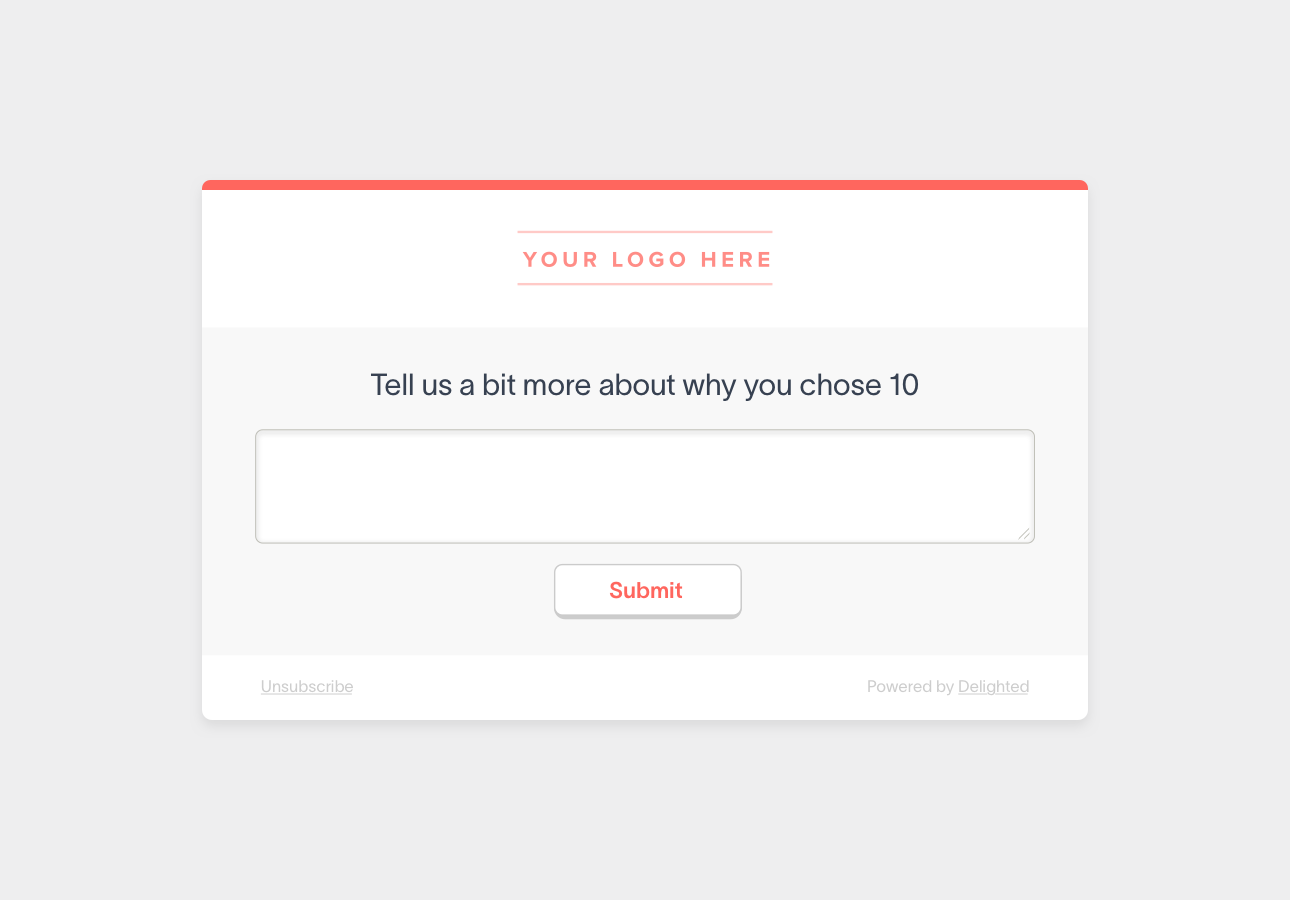
The classic NPS question is: “On a scale of 0-10, how likely are you to recommend [Company] to family and friends?” Follow up with an open-ended question asking why they chose a specific number. You can also modify the NPS survey question to ask about a specific product or support interaction.
Delighted has a templated NPS survey that you can easily customize to suit your needs.
Demographic questions
Demographic survey questions are multiple choice questions that appear at the end of almost every questionnaire. These questions help you understand who your customers are and where they come from. They ask questions about location, age, income, gender, race, or lifestyle.
Demographic question pros
Tell you about your customers so you know how to market to them
Help you target a specific audience or group
Demographic question con
Some respondents may not feel comfortable answering personal questions
Demographic question tips
Avoid asking what you already know about your customers
Only ask for information that impacts your business strategy
Demographic question examples
How old are you? Provide mutually exclusive options such as under 18, 18-24, 25-34, 35-44, 45-54, 55-64, 65+ years old
What is your annual household income? Provide multiple options such as $0-$29,000, $30,000-$59,999, $60,000-$89,999, $90,000-$119,999, $120,000+
How many employees does your company have? Multiple choice options can include 1-10, 11-25, 26-50, 51-80, 81-120, 121-250, 251+
Other questions can include ethnicity, marital status, education, industry type, business locations, etc.
Open-ended questions
Open-ended questions are a qualitative data collection method that allows respondents to answer in their own words. Of the different types of survey questions, the open-ended format encourages respondents to add supplemental details. These questions prompt customers to share their opinions in greater detail, resulting in them feeling more heard and valued during the feedback process.
These questions require more critical thinking and provide insights into your company that you may not have been aware of. They’re perfect for following up on answers to quantitative close-ended questions to get more context.
Help you understand the why behind their sentiment
Provide qualitative data
Capture simple customer information, such as email or product purchased, for surveys that are distributed in a more anonymous manner (e.g. kiosk or web)
Open-ended question cons
Time-consuming to answer and analyze
Less engagement
Open-ended question tip
Use open-ended questions to invite customers to explain their rating after a close-ended question, so you can tie that open-ended feedback to a score
Remember that open-ended questions provide valuable insight into your customers’ thoughts, but not statistical or categorical data.
Open-ended question examples
There are plenty of ways to ask open-ended survey questions. For example: “Tell me more about why you chose [rating/option]” is the classic open-ended question for following up on a close-ended question. Asking “How can we improve?” or “Is there anything else you would like us to know?” at the very end of a survey can also capture any feedback your previous questions didn’t surface.
Tips for writing good survey questions
Now that we’ve covered survey question types, let’s review some tips and best practices for crafting great questions and designing effective surveys.
1. Use clear language and avoid jargon
When crafting your survey questions, be sure to use language that’s easily understood by your target audience. If survey questions contain confusing terminology, acronyms, or technical jargon, survey respondents may become confused or frustrated, or worse, drop out of the survey altogether.
Our advice? Keep your survey questions as straightforward as possible. That way, respondents are more likely to understand what is being asked of them and provide accurate, honest answers. This will lead to more insightful data and a better understanding of your audience.
2. Avoid leading questions
Of course, you want insights you can take action on, but asking leading questions – that is, questions that encourage or guide the respondent toward a desired answer – can do more harm than good.
Asking leading questions has the potential to not only return unhelpful responses, but also produce misleading or biased results – results that, should you take action on them, could lead to some unintended (and unwanted) business outcomes.
3. Avoid asking two questions in one
Like leading questions, double-barreled questions can confuse respondents and hinder your survey results. This type of survey question asks two questions in one, making it impossible to know which question the respondent’s answer applies to.
Thankfully, double-barreled questions are easy to identify because they typically include words like “and” or “or” to connect the series of questions. Be sure to always proofread and weed out these types of questions from your surveys.
4. Keep your questions – and survey – short and to the point
The shorter your survey is, the more likely respondents are to complete it. Not only do shorter surveys boost your survey completion rate, but they also increase your survey response rate in general. To set expectations ahead of time, let your respondents know how long the survey will take to complete in a survey introduction message.
5. Focus on effective survey design
How you design and use different types of surveys matters just as much as the questions you ask. When creating your survey, follow these design best practices to ensure the survey is as effective as possible in reaching your research goals.
Here are some common best practices to follow:
Define clear goals for your survey
Distribute surveys through the best channel for your business
Use skip logic so customers can skip questions they don’t want to answer
Enable conditional logic so customers are shown questions based on previous responses
Ready to get started? Try out all types of survey questions and collect actionable feedback with Delighted’s free survey tools.
A landmark study found that 80% of 362 companies surveyed thought they provided a “superior experience,” but only 8% of their customers agreed. That huge disparity highlights how sorely companies can miss the mark when it comes to understanding their customers’ needs and expectations.
A key way to close that gap and develop solid, lasting relationships with your customers is to ask them for feedback with customer satisfaction surveys. But when do you ask? And what questions should you use?
Once you’ve designed and distributed your customer survey, the next step can be the most exciting part of the process: watching the responses roll in.
Unfortunately, the reality is that you may not get as many responses from your first survey project as you would like. This low survey response rate can lead to concerns over unreliable feedback or a lack of helpful customer insights.
Gathering and analyzing feedback is fundamental to a strong customer experience program. However, all of that feedback is meaningless if you don’t act on that feedback and close the loop with your customers.
That’s why today, we’re very excited to announce the Delighted + Klaviyo integration, which is now available on all Delighted plans.
Think of the shopping, dining, or travel experiences you enjoyed most. They probably didn’t just come down to the quality of the food or the products that you bought. They were associated with an experience that, as a whole, was pleasing and memorable.
Every interaction between a customer and your brand defines the customer experience. And, with 81% of marketers predicting that customer experience is how they will differentiate themselves from the competition, prioritizing CX now is how you can stay ahead of the curve to ensure growth in the future.
There is no other area that allows you to set your brand apart from other companies like customer experience. Other retailers may offer similar products. They may find a way to beat you on price. But, if you can deliver an exquisite experience for all of the customer interactions that matter, you will be the brand that wins. Plus, you will build a loyal user following that promotes your ability to consistently meet customer expectations.
The key is understanding what a customer is experiencing each time they interact with your brand, and how you can make that experience even better. Let’s look at how to measure customer experience and which metrics for customer experience to focus on so you can start boosting customer happiness today.
What is a customer experience metric?
Like everything else in your business, customer experience (CX) can be improved most effectively when it can be measured. With measurement data, you can identify the best ways to resolve critical customer pain points.
Customer experience metrics are a collection of criteria that your organization can use to measure how happy your customers are, so that you can actively work towards increasing customer loyalty and reducing churn.
Some metrics that can indicate how your customers feel about you are based on operational data. Metrics like resolution time on support teams or the lifetime value of a customer are easy to measure, providing clear and objective data to set team goals.
Other criteria that deal more explicitly with customer sentiment toward your brand can be tougher to measure. These customer experience metrics measure things that can seem subjective, such as customer satisfaction. However, by asking your current and potential customers the right questions, you can get a clearer picture of how the customers you value feel about you.
By evaluating your operational data in the context of customer experience metrics driven by actual customer feedback and sentiment, you’ll have a better idea of where you’re hitting the mark with customers, and where there’s room to improve.
For instance, you might learn that customers are generally satisfied with their experiences with you, but aren’t excited enough that they promote you to their friends. Or, you may learn that your customer service agents are great at solving customer issues, but a majority of callers are waiting much too long to get access to that stellar customer service.
Over time, measuring your performance leads to the best customer experience possible, which, in turn, leads to more valuable relationships and better revenue for your brand. You can learn which improvements are likely to reduce churn and make customer relationships last longer. You’ll also learn which actions you can take to turn current satisfied customers into happy advocates for your brand.
Which metrics should you track?
There is no one set answer to this question. The metrics you should track depend on what insights or knowledge gaps you are trying to fill, and the customer touchpoints you’re looking to explore.
To start, it’s important to understand what your goals are. Are you striving to improve the ease of your checkout process? Or, maybe you want to know how loyal your customers are to your brand in general. Once you nail down your goals, you need to figure out the metrics that measure those goals. And once you select the metrics, you can use them as key performance indicators for customer experience (CX KPIs) so that your team can get laser-focused on benchmarking and improving your scores.
Your brand will not succeed or fail based on a single metric. Your success, instead, is based on what you do with those numbers and how you’re staying on top of them. These are criteria that you can use to see where you need to enhance your brand experience based on values you can authentically promote. Over time, you should see improvement as you put changes in place.
Popular experiential CX metrics
Choosing your metrics can seem a little daunting. The popular experiential CX metrics below are a good place to start. You can measure them using a customer experience management software to learn more about how your customers feel about your brand.
Customer Satisfaction (CSAT) score
What is CSAT? CSAT, or customer satisfaction, is a metric that measures how satisfied customers are with your products and services. It is most commonly measured every time one of your customers interacts with your customer service representatives. However, you can also use CSAT surveys to gather feedback on a product, sales demo, or any other instance where a customer interacted with your brand using our customer satisfaction software.
Depending on what touchpoint you’re gathering feedback on, this measurement can give you a good picture of how the teams responsible for each aspect of the customer journey are performing, and how well your products are resonating with your customers.
CSAT is typically measured through a one-question survey. Ask the customer to rate how satisfied they were with their interaction. Options can go from 1 for completely dissatisfied to 5 for completely satisfied. For more insight, append an open-ended comment form to the initial CSAT question so customers can explain why they chose that customer experience rating.
Then, calculate your CSAT score by dividing the number of people who rate their experience a 4 or 5 by the total number of people who responded. The number you get, expressed as a whole number, is your CSAT rating. So, if a total of 100 people responded to your survey, and you are given 60 5s and 13 4s, you have a CSAT rating of 73.
Net Promoter Score (NPS)
Net Promoter Score is a number that predicts how likely someone is to talk favorably about your brand. The higher your score, the more positive buzz your company is likely to generate. It also reflects higher trust in your brand. When people know the person who speaks positively about a business, it makes them more likely to do business with you, too.
In marketing, this is often referred to as “social proof,” and it is recognized as one of the most powerful tools in your repertoire. People trust the opinions of the people they know. If those opinions of your brand are positive, the trust that a prospect has in their friend transfers to you.
NPS is measured through a single question that asks customers to rate on a scale of 1-10 how likely they are to recommend you to a friend. Customers who are 9s and 10s are more likely to speak positively about your brand, and 0s through 6s are more likely to speak negatively.
This rating question is followed by an open-ended comment box where customers can provide extra feedback on the context that led to the score. This context is where you’re most likely to get the concrete feedback you need to improve your score, and your customer experience.
Your final Net Promoter Score can range from -100 to 100. To calculate your NPS, subtract the percentage of detractors from the percentage of promoters.
Customer Effort Score (CES)
This number describes just how hard it is for someone to achieve a specific goal with your brand. This goal could be getting a product shipped to them, resolving a complaint, or simply getting the answer to a question before they order.
The reason that this metric is valuable is because it helps erase friction between your customer and a conversion. Every additional hurdle a customer has to get over makes it that much less likely that they will continue to do business with your brand.
Determine your CES by asking customers to rate from 1-5 how easy it was for them to accomplish their goal, phrased “[Company] made it easy for me to [accomplish a task].” The number of people who agreed (rated you 4 or 5) divided by the total number of survey responses is your score.
When someone walks into your storefront, navigates to your webpage or calls you on the phone, what do they wish to accomplish? How well does that intent align with what they actually do when they interact with your brand?
Intent can be found by surveying customers. For example, to learn more about how customers feel about your online Help Center, you can start with a website CES survey question: “[Company] made it easy for me to find the support resources I was searching for” with an agree-disagree answer scale. Follow up with an open-ended question that asks “What was the primary resource you were looking for today?” to gain more qualitative insight around their intent.
Once you understand what your customers are trying to accomplish, you can create or improve upon the experiences that help them accomplish their goals.
Employee engagement (eNPS)
Employee engagement, measured through an employee NPS (eNPS) survey, and customer experience are intrinsically linked. Employees who feel engaged and enthusiastic about the company and the job are likely to pass that positive feeling along to the customers when they interact. By the same token, employees with a low level of engagement are less likely to give each interaction their all.
Short, frequent, anonymous surveys are a good way to gauge employee engagement. You can modify the Net Promoter Score question to be employee-facing by asking “How likely are you to recommend working at this company to a friend or family member?”
Follow that initial question with Additional Questions about morale levels, the level of challenge they feel in their job, and how engaged they feel in their current tasks.
Top operational CX metrics
The experience-related metrics above are based on subjective criteria. Nonetheless, measuring customer experience with metrics can give you some of the most direct information about how your customers feel about your brand.
Using them together with these operational CX metrics can help you see how you are currently doing, and how you are progressing toward your goals over time. Many of these metrics can be extracted from your customer relationship management (CRM) tools or through specific CX metrics tools.
Important metrics to watch over time include:
Customer churn
Customer churn, which is also often referred to as customer attrition, is the rate at which customers choose to stop doing business with your brand. There is no one predictor that will lead to churn. However, keeping up with this number can show you when you are failing to retain customers. On average, a company will lose around 15% of its customers each year. If you can reduce churn to a level that is lower than your competition, you are ahead of the game.
Retention is the opposite of churn. Your customer retention rate is the proportion of your customers who come back to do business again with your brand. Attaining and converting new customers is time-consuming and expensive. If you can reduce churn and increase your retention rate, you can significantly increase your company’s net revenue over time.
Customer lifetime value is the revenue from a customer over the life of your relationship with them. The higher the lifetime value, the better your return on your investment in this customer. Keeping customers happy with your brand is key to retaining them and increasing their spending with you.
You can also increase customer lifetime value by using tactics that increase spending with you during any one session. For instance, a shopping cart add-on that suggests related products can increase customer lifetime value. Well-timed emails that check in on the customer and make them feel cared for also increase lifetime value.
How do your customers interact with your brand? When they visit your site, how long do they spend there? What actions do they take? Which pages do they head to most? How often do they start an action, such as a purchase, but abandon it before they complete it?
Information in this category can tell you a lot about the experience that your customers are having on your site. If they are frustrated with navigation, the amount of fields you require them to fill out, or another factor, it will come through in their behavior. Watching how they behave can allow you to create a site that is more intuitive, relevant, and user-friendly, and ultimately increase your conversions.
Tracking cookies, combined with website surveys to measure visitor intent, can tell you about how customers behave when they visit your site. By tracking their behavior over time, you’ll be able to see which changes have the most positive impact.
Customer support metrics
These are measurements that will include technical details of interactions with customer support. How long until a customer receives a response? How long does it take to get from the initial conversation to a resolution? The latter should be measured in the number of interactions as well as the time spent by the customer each time they contact your brand.
Leaving a business because of poor customer service is an incredibly common occurrence. More than eight in ten consumers say that they’ve stopped doing business with someone because of bad customer service.
However, even more say that they will go back to a business who makes a mistake and fixes it through good customer service. The better your brand is at solving customer service dilemmas, the more likely that brand is to retain their customers over time. This, in turn, dramatically increases the lifetime value of each customer and your company’s revenue.
Each of these metrics should be measured on a regular basis so that you can see how your teams and your organization as a whole are working toward a better customer experience. Over time, you can see where you are improving, where your brand’s products and services are resonating positively with customers, and where you need to use new tactics.
We can help you get to the data that will tell you more about your company’s CX. Delighted makes it easy to create customized surveys that give you the answers you need in a simple, clear format. You can also easily integrate all of your experiential metrics into your existing CRM tools, so you can analyze customer feedback in the context of your operational customer experience metrics.
Ready to get started? Sign up to start collecting customer feedback at no cost.
You’ve done the hard work and earned your customer’s attention, but do you know how loyal they are to your brand or how engaged they are in your business? Do you know why some customers tend to stay while others go?
Relationship and transactional surveys measure your customer experience, whether that’s through Net Promoter Score (NPS), Customer Effort Score (CES), or Customer Satisfaction (CSAT) metrics, so that you can better understand the “why” behind customer engagement and loyalty.
So you’ve done the hard work of gathering customer feedback. You’ve created the perfect survey with a reliable distribution method, and as a result, have a gold mine of customer input at your disposal. Now it’s time to put that data to use with some customer feedback analysis.
No matter how well-executed the survey, you won’t get much use out of your feedback if you don’t analyze the results.
Surveys are an important part (perhaps the most important part) of understanding your customer. A well-crafted survey can provide a wealth of insights around how customers think about your market, product, or service, and enable you to better solve customer problems, reduce the risk of them leaving, and accelerate your business’s growth.
First things first — what is a voice of the customer (VoC) program and why should you have one?
A VoC program is the way a company gathers, analyzes, and acts on customer feedback to create a customer-centric culture. A successful voice of the customer program puts your customers’ needs center stage, and ultimately drives brand, product, and service improvements for an unbeatable customer experience.
Most of our customers start their customer experience journey with Delighted tracking a single metric like Net Promoter Score or Customer Satisfaction Score. As they experience the power of customer feedback to drive actionable insights and improvement, they often want to expand to understand other parts of their customer journey.
Today, we are launching Projects so that you can expand beyond a single customer experience (CX) metric. Now, you have the power to layer in other survey types for new touchpoints, different teams, and more. And all of this with the ease and simplicity you expect from Delighted.
Creating a great customer experience (CX) is important—but where do you start?
At their core, customer experience programs uncover how customers interact with your brand, product, or service. The best CX programs ask the right questions in the right way at the right time to the right audience.
When you’re juggling feedback from multiple sources and various customer segments, customer experience survey data analysis can get very overwhelming, very fast.
That’s why today, we’re very excited to introduce the much-requested Reports section of the Delighted platform, which is made up of three features: Snapshot, Over Time, and Pivot Table. With Snapshot and Over Time, you’ll be able to visualize your survey results in presentation-ready charts instantly. Using Pivot Table, you can summarize your survey data in one user-friendly, interactive table. You can also use it to see the most frequently used keywords from your open-ended feedback to surface unexpected trends.