

One of the most common questions we get from our customers is: What type of survey response rate can I expect?
When doing some research, you’ll see a wide range of numbers on what a “good” or “average” survey response rate is. These response rate benchmarks are usually qualified by a specific distribution channel or survey type:
- 33% as the average response rate for all survey channels, including in-person and digital (SurveyAnyplace, 2018)
- >20% being a good survey response rate for Net Promoter Score surveys (Genroe, 2019)
Let’s dive in further to learn the definition, variations, and significance of survey response rates.
What is a survey response rate?
Survey response rate is the number of people who complete your survey compared to the total number of people who received your survey. Survey response rate is a percentage calculated by dividing the number of completed surveys by the total number of those surveyed (and multiplying it by 100).
For example, say you survey 1,000 people and 150 people respond – your survey response rate would be: 150/1000 = 0.15 x 100 = 15%.
What is a good survey response rate?
So, what is a good survey response rate? Factors that impact this include, how engaged your customers are with your brand, and whether you’re delivering surveys in a way that’s easy for them. Nevertheless, a good survey response rate ranges between 5% and 30%. An excellent response rate is 50% or higher.
Average survey response rates: Benchmarks from our 2021 data
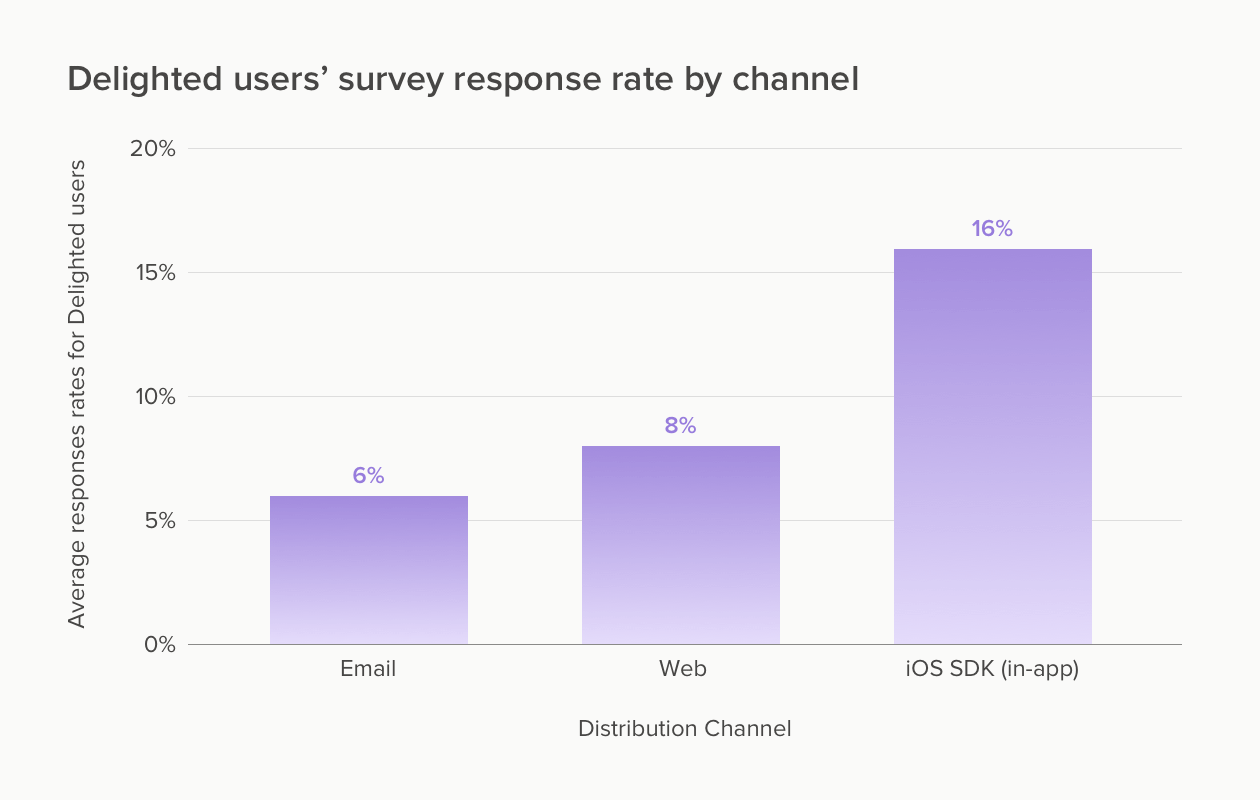
The average survey response rates ranged from 6 to 16% among Delighted users, varying by survey channel. iOS SDK surveys scored the highest response rates followed by website and email surveys.
- 6% for email surveys
- 8% for website surveys
- 16% for iOS SDK surveys
We were curious how the pandemic years may have affected survey response rates, and within each channel, the differences were pretty minimal. From what we’ve gathered, businesses that had to pause or slow down during the pandemic also limited the scope of their feedback programs. Customers who were receiving services still responded to feedback surveys at a similar rate.
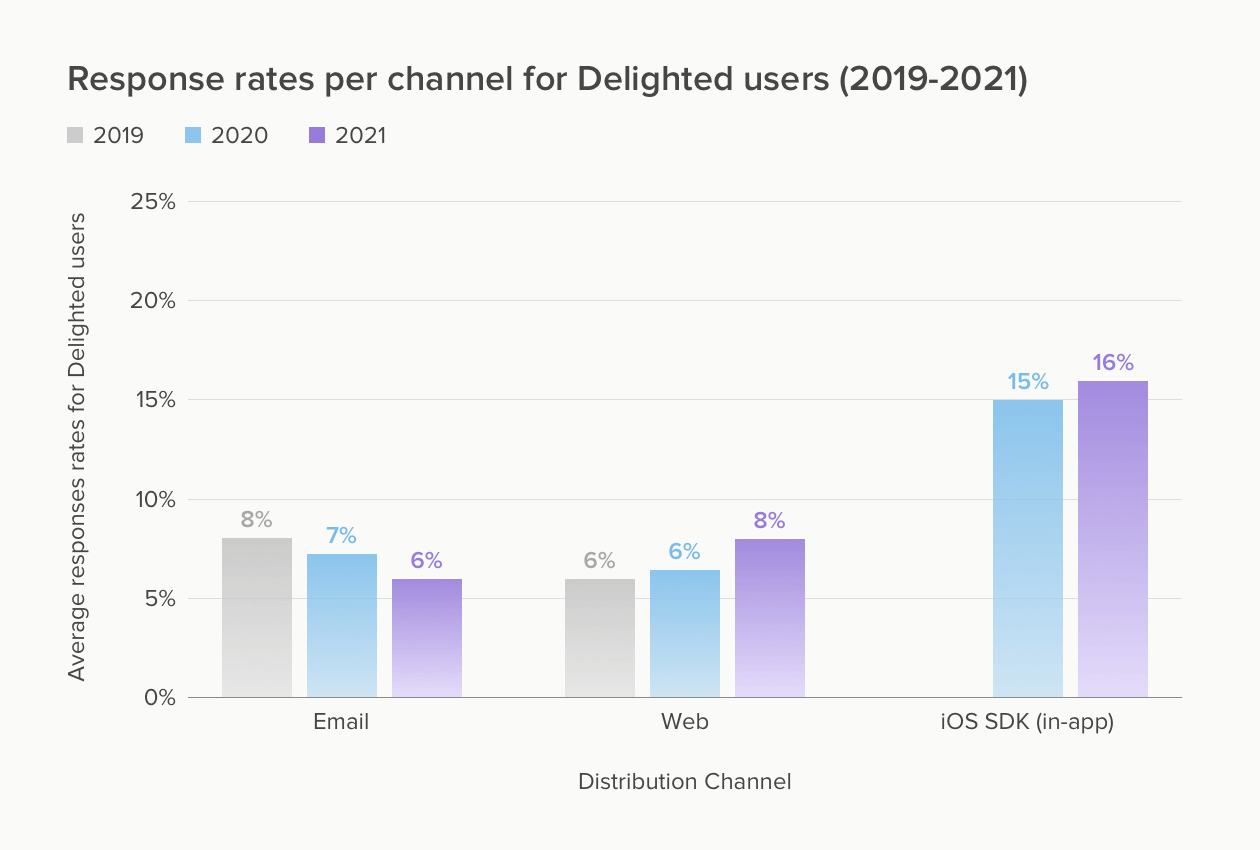
What’s interesting to see is that there’s been a minor dip in response rates for email surveys over time, and a slight increase in response rates for surveys that are embedded into a user workflow – web and in-app.
Across the board, one of the lasting impacts of the pandemic has been an accelerated drive towards digital-first experiences. What the trend above suggests to us is that since more customers are in digital channels, embedding your survey into their user flow could be an effective way to get more feedback.
The takeaway: Response rates vary widely depending on the channel you’re using.
On the upper end, some of our customers have had response rates as high as 85% for email eNPS surveys and 33% for email NPS surveys.
Ido Breger, VP of Product for Cynet, recounts how switching from email surveys to web surveys dramatically increased the amount of feedback they received:
“Before we started using Delighted, we were sending email NPS surveys that just sat in our customers’ inboxes. Our response rates were so low that we couldn’t get an accurate NPS score with high probability.
We realized we needed to embed the survey into our customers’ normal workflow and make it very easy to give feedback.
With Delighted, a pop-up question appears on the website that our users can complete in a single click.
After maybe 10 days, we had six times the responses that we’d had within the last six months. It made a huge difference, and now NPS is something we actively participate in improving across the whole business.”
– Ido Breger, VP of Product at Cynet
While it can be helpful to compare your survey response rate to an external benchmark, it’s even more important to set your own internal benchmarks by customer segment, survey type, and service tier. Try different channels and messaging to see what works best for you and your customers.
Why do survey response rates vary so much?
A wide variety of factors can impact how high your survey response rate will be, the most important being how engaged your audience is with your brand. Survey response rates can also vary by:
- Industry: B2B vs B2C, with the likelihood of survey responses for B2B being higher than B2C
- Your audience demographics: younger audiences may be more likely to respond than those over 65, especially if you’re using digital survey tools
- Internal employee surveys vs external customer surveys, with response rates for employee surveys trending higher
- The type of feedback you’re gathering: transactional surveys (CSAT or CES) tend to have higher response rates than relational NPS surveys – for example, our post-support CES survey response rate via an email signature link is 20%
- Whether an incentive is offered to complete the survey
- Survey distribution channel and timing
Timing can play a much larger role in your survey response rate than you might expect.
“Recency from an event, specifically for transactional NPS or event-based surveys, is a major driver of response rates.
For example, sending a post-support survey 24 hours after an interaction versus 7 days after an interaction is likely to produce better results, since customers know why you’re reaching out, and have top-of-mind feedback to share.”
– Sean Mancillas, Head of the Delighted Customer Concierge Team
To move the discussion away from the actual response rate number for a minute, let’s go bigger picture: what impact does your response rate have on your CX program?
Just how important is survey response rate?
The question of survey response rate is tied to statistical best practices for survey sample size – just how much feedback do you need to have an accurate understanding of your audience. The more pieces of feedback you have, the better, right?
Not quite. Just because you’re able to increase the number of people who respond to your survey, doesn’t mean the feedback you’re getting is more representative of the customers who matter most to you.
Here’s what research scientists in the space have to say:
“Concerns about response rates have solid theoretical grounding. You can’t make inferences about a larger group if people in the group won’t talk to you. Most of our statistics and margins of error assume having information from every member of a random sample.
But the reality for most research is that response rates are not high. And yet our findings are still accurate and there is evidence that sometimes lower rates give us more accurate findings. The reason? What matters is not how many people respond to a survey, but how representative they are of the groups to which they belong.”
Do response rates really matter, Versta Research
“What counts most, of course, is high response rates from your core or target customers – those who are most profitable and whom you would most like to become promoters. Retail banks, for example, find it helpful to survey their customers by segment, so that the responses of their most profitable clients aren’t drowned out by those who are only marginally profitable.”
Net Promoter System: Creating a reliable metric, Bain
Though your business situation may vary, one concept holds true. Segmenting your customers and ensuring you’re hearing the voices that matter most is the key to success.
One of the easiest ways to do this is to connect your feedback tool to your CRM, so you can segment customers by service tier and gain a better understanding of how each of your customer cohorts feels about your business. You can also then confirm that you are hearing from the customers that drive your business forward.
None of the above discounts the importance of having a strong, consistent flow of customer feedback. If you’re getting little to no feedback, try taking these steps to strategically improve your survey response rates.
What role does response rate play when you’re thinking of how you’ll set up your CX program?
Many of our customers are setting up a customer experience program for the first time, with questions on how response rate factors into their program optimization.
Sean Mancillas, the Head of the Delighted Customer Concierge Team, shares his guidance:
“Our role is definitely to help ramp up the volume of feedback by strategizing around best practices and sampling, but also to manage and report on the feedback in a way that can tell an effective story. If you’re getting a 20-25% response rate, but it’s scattered across totally disjointed and unrelated subsets of customers, the feedback is going to be all over the place and will produce super confusing net results – potentially worse than just a lower response rate.
When we’re helping on response rates, we’re also working with you to scope your CX program a bit more thoughtfully to specific customer segments (e.g. folks that are more active, with a recent purchase, from X location) – which naturally leads to better engagement and a quality of feedback that can really drive effective reporting and a strong customer narrative.”
For more specifics on building your program with statistical significance in mind, check out our post on survey sample size or use our sample size calculator to find your ideal sample size.
How Delighted optimizes our own CX program for maximum feedback
We’ve done quite a bit of work on figuring out how best to reach our audience, and it has paid off. (Check out best practices to follow in this guide on increasing response rates.)
Here are the actual response rates we get when we send surveys out to our own customers to find out how much they like using Delighted.
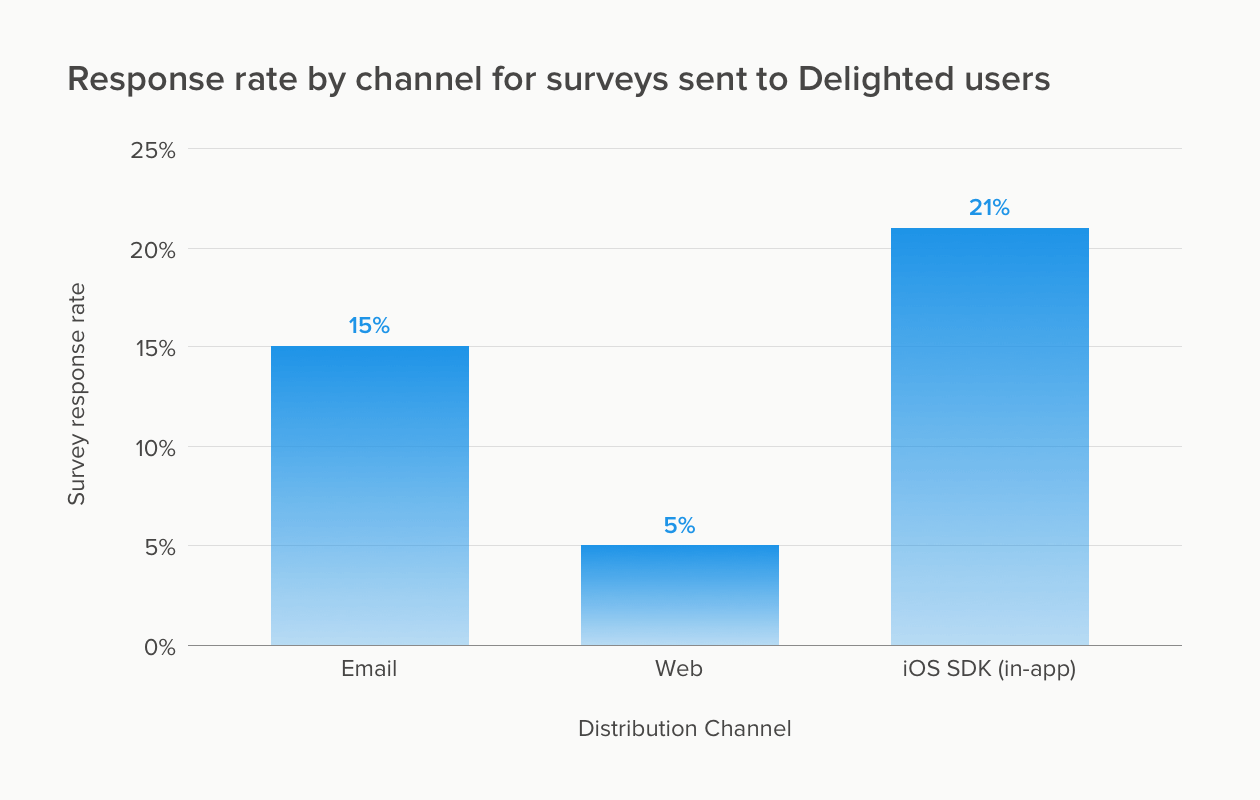
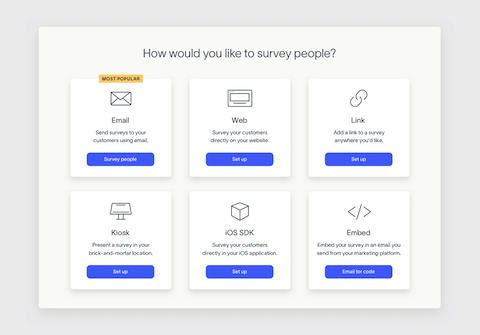
You can see that we use multiple survey channels – email, web, and iOS SDK – to cast as wide a net as possible. The response rate varies substantially from 5% to 21% depending on the channel. Before we started using iOS SDK surveys, our internal response rate for email surveys was 21%, while for web surveys it was 10%.
Your response rates will fluctuate as you test the best distribution channel for your audience. Since we’re a B2B business with an app, it makes total sense that the iOS SDK channel would be a great way for us to gather NPS feedback.
At the same time, we still want to continue using email and web surveys to capture feedback from stakeholders who aren’t always logged into our platform.
If you’re itching to see how much customer feedback you can gather, try Delighted’s customer experience solution or customize one of our survey templates. Your surveys will be out to customers in minutes!