

Though the terms sound similar, qualitative vs. quantitative research are two significantly different data collection methods. Understanding that difference can make a large impact on how you analyze the success of a product, service update, or overall company performance.
Let’s take a look at the difference between qualitative and quantitative research, when to use each (or both), and how to gather the data sets effectively.
What’s the difference between qualitative and quantitative research?
Qualitative and quantitative research are two different approaches to collecting data used to test hypotheses. Quantitative research is a numeric method of collecting data, whereas qualitative research is a non-numerical approach to data collection.
Quantitative research
Any data that can fall neatly into a numerical system or rating – number of customers, dates of purchases, revenue, Net Promoter Score (NPS), and so on – falls under the quantitative research bracket.
Quantitative data forms the what: the tangible aspects of an audience’s interest, such as sales data or customer engagement metrics.
The key benefit of quantitative data is that it is easy to analyze, as it is highly structured. Once collected, you can generate and categorize information easily with graphs, percentages, and tables – making it ideal for organizing on a dashboard.
This type of data helps you to more easily spot trends, make predictions, and see correlations. It’s easy to replicate your research, compare results, and analyze large quantities of data.
The downside of this type of data is that it’s hard to understand the motivation or reasoning – in essence, the context – behind the information you collect, making it difficult for you to confirm any theories you have based on what drives the data. Or, there might be structural bias, as you might be looking for the wrong type of data for your problem, measuring data incorrectly, or using an incorrect sampling method.
This is why qualitative research is equally as important to consider.
Qualitative research
Qualitative research usually involves studying language – words, their meaning, concepts, and opinions. It analyzes the why – what an audience thinks and why they hold a certain opinion. This data can be gathered from text, images, audio or video clips, and more.
The key benefit of qualitative data is that it helps you understand the motivations for your audience’s actions. It can explain the “what” as outlined in quantitative data, helping you to troubleshoot issues and create new ideas for research.
Qualitative data is also flexible and represents your audience’s views authentically. It’s descriptive, which helps you understand context more fully.
The downside of qualitative data – as most qualitative researchers will agree – is that it is by its very nature difficult to quantify, as it’s likely to be unstructured or semi-structured data. Qualitative data is also subjective, and relies on your audience to be truthful throughout the data collection process.
When to use qualitative vs. quantitative research and why
Both approaches can help you gain insight into your target audience group, but when is it more appropriate to use quantitative or qualitative data collection?
Use qualitative research to understand a problem, opinion, or experience
Qualitative data gives you the ability to understand the more nebulous facets of your audience’s experience and their opinion about these aspects.
Examples of when you might use qualitative research include:
- Understanding why a product isn’t performing as well as you’d hoped
- Finding out how to improve your retail experience
- Getting insight into why a customer values you over a competitor
Collect quantitative research to test a hypothesis
Quantitative data gives you concrete results, meaning you can use it to test or confirm theories you might have about your audience’s experiences.
Examples of when you might use quantitative research include:
- Understanding customer effort, customer satisfaction, and more
- Testing how a change in customer experience affects your audience
- Confirming a theory, such as why customers like a certain product or service
Using a combined or mixed method to get the whole picture
Using both qualitative and quantitative data will give you a more comprehensive understanding of your audience’s drives and the tangible outcomes of their attitudes and opinions.
You could use both types of data to:
- Get insights from your audience (qualitative data) to create a theory and use quantitative research to test it
- Identify patterns in your quantitative data, and understand why they’re occurring with qualitative information
How to gather qualitative and quantitative data
There are many ways to gather qualitative and quantitative data, no matter what sample size you’re working with in your study. The methods below include both qualitative and quantitative research methods.
Surveys
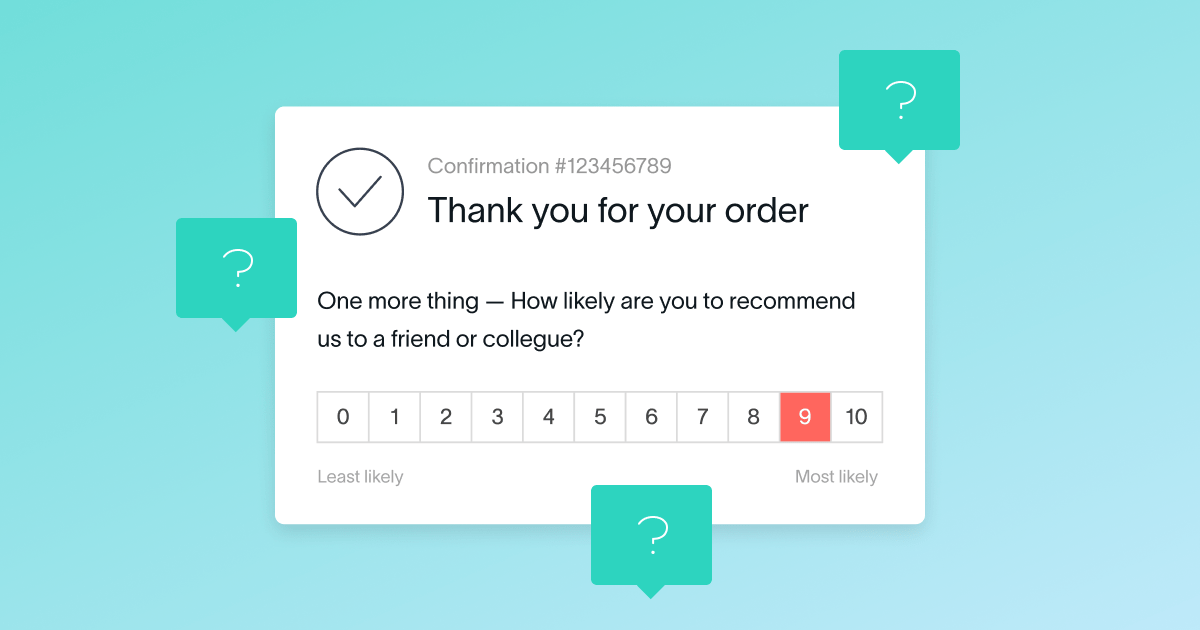
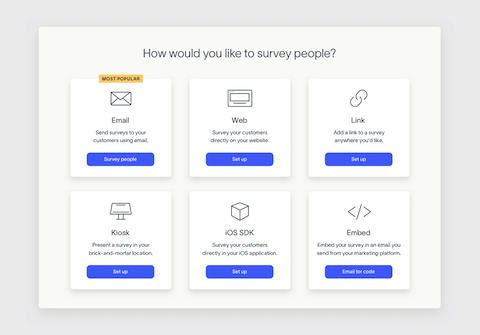
Likely the easiest way to gather qualitative or quantitative data, surveys allow you to deliver your research questions to your audience quickly and easily gather data for analysis. They can be served to participants in multiple ways – via email, in-app, on your website, and more.
Focus groups
Interviewing a select group of individuals to get their opinions on certain products or topics can give you honest insights from consumers.
Observational research
Observing how people use your business’s products and services can help you spot problems and troubleshoot them first-hand.
In-depth interviews
One-on-one discussions with individuals who could have keen insight into your business can help unveil more human insights into your company.
Case studies
Collecting stories from those who’ve used your products and services can help illuminate problems and successes.
Third-party research
Using third-party data can help you understand your business’ position when compared to others. This research is more likely to yield quantitative data.
Examples of quantitative survey questions
If you’re aiming to take action to improve your customer experience, you’ll need to ask the right questions. Depending on whether you’re looking for quantitative, qualitative data, or a combination of both, you’ll want to use different question styles.
Let’s review some of the most common quantitative survey question types.
Likert scale questions
Likert scale questions evaluate how much the survey respondent agrees with a particular statement by asking them to select a score on a numerical scale as it aligns with their sentiment.
You can then calculate the quantitative data for a chosen group of responses to produce an overall score to determine if you’re meeting or not meeting expectations (depending on what you’re measuring).
Sample quantitative Likert scale questions include:
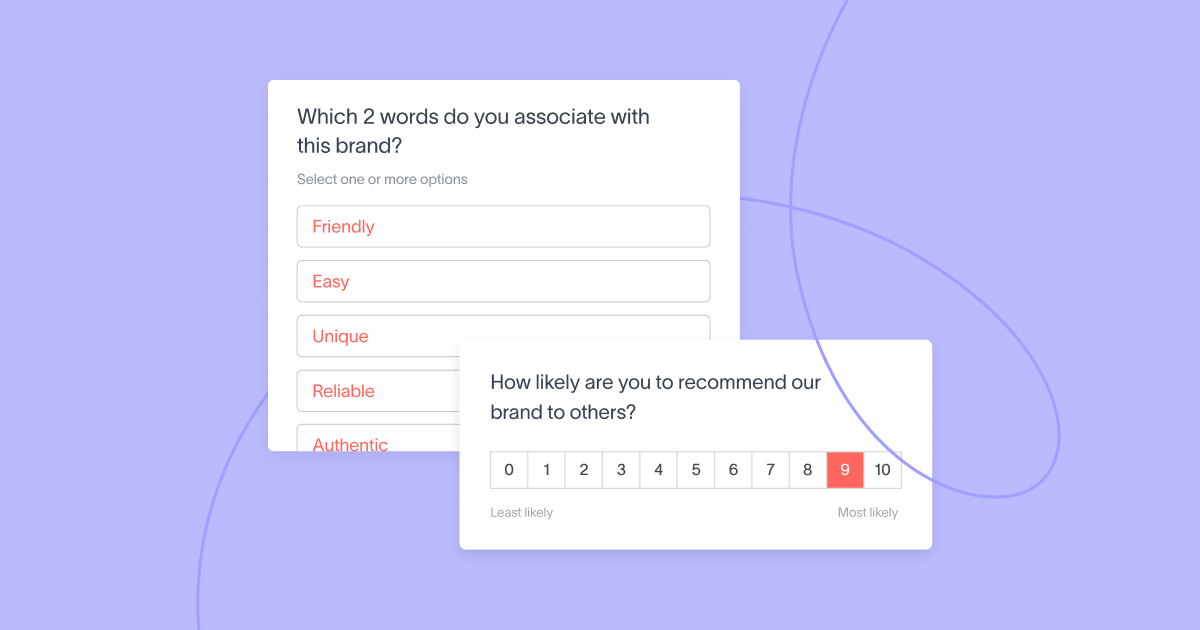
- Net Promoter Score (NPS): How likely are you to recommend [brand/product/service] to a friend? Answer scale: 0 to 10
- Customer Satisfaction Score (CSAT): How satisfied are you with [product/service]? Answer scale: 1 to 5, Very dissatisfied to Very satisfied
- Customer Effort Score (CES): [Product feature] made it easy for me to accomplish [feature goal]. Answer scale: 1 to 5, Strongly disagree to Strongly agree
- How satisfied are you with the quality of the product? Answer scale: 1 to 5, Very dissatisfied to Very satisfied
- How likely are you to [repurchase/renew the contract]? Answer scale: 1 to 5, Very unlikely to Very likely
- This [product/service] helps me accomplish my goals. Answer scale: 1 to 5, Strongly disagree to Strongly agree
Star rating, smileys and thumbs up/down rating
Similar to the Likert scale, a 5-point rating scale can be used with Smileys or Stars surveys. Universally recognizable and visually intuitive, it’s a simple way to get quantitative responses and sentiment data that can be tracked over time.

Thumbs up/down surveys are also an easy way to gauge your audience’s views. Innately straightforward, a two-option survey can lead to faster survey completion from your respondents and instant quantitative data collection.
Multiple choice and multiple answer questions
Giving your audience multiple options can help narrow down details on preferences, usage, quantity, frequency, and more. Though these questions contain words in the selection options, you are actually gathering objective, quantitative data that can work to support your statistical analysis.
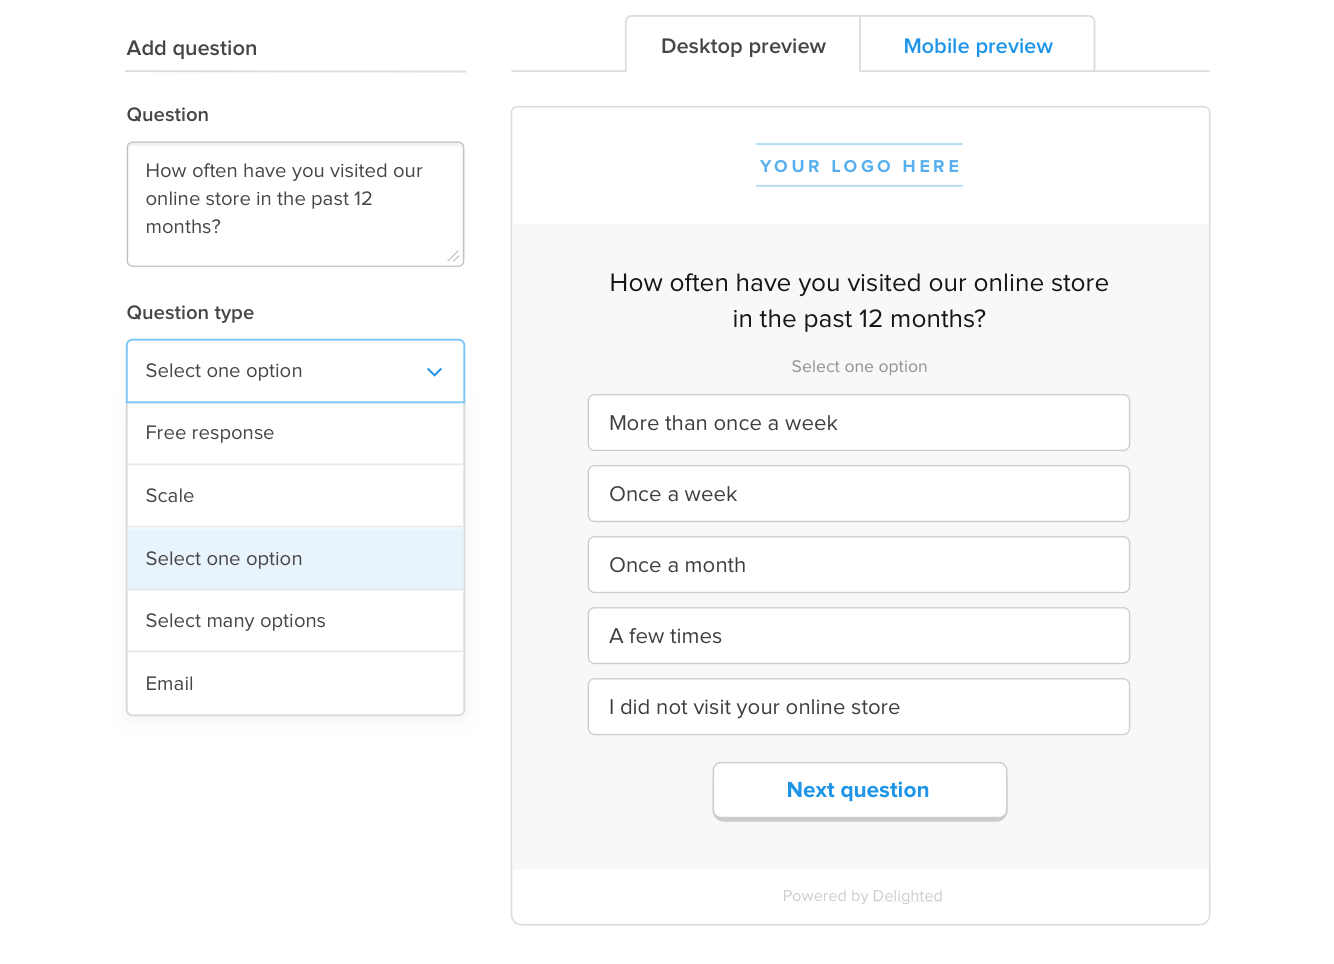
Some question examples include:
- How often do you visit our online store? [Option 1] [Option 2] [Option 3] [Option 4]
- Which of our services have you used? Check all that apply: [Option 1] [Option 2] [Option 3]
Examples of qualitative survey questions
Numerical, quantitative data makes tracking, reporting, and sharing data across your organization possible. However, gathering qualitative feedback from your audience can unveil specific details about your quantitative data – why a customer gave a negative score or verbatim suggestions for how to improve – that can make a more strategic impact.
“Other” option after multiple select or multiple answer
If the respondent does not find that your provided options match their opinion, you can provide an “other” box to have them write their answer. This reduces the chance of survey bias and provides qualitative feedback on why they don’t align with the given options.
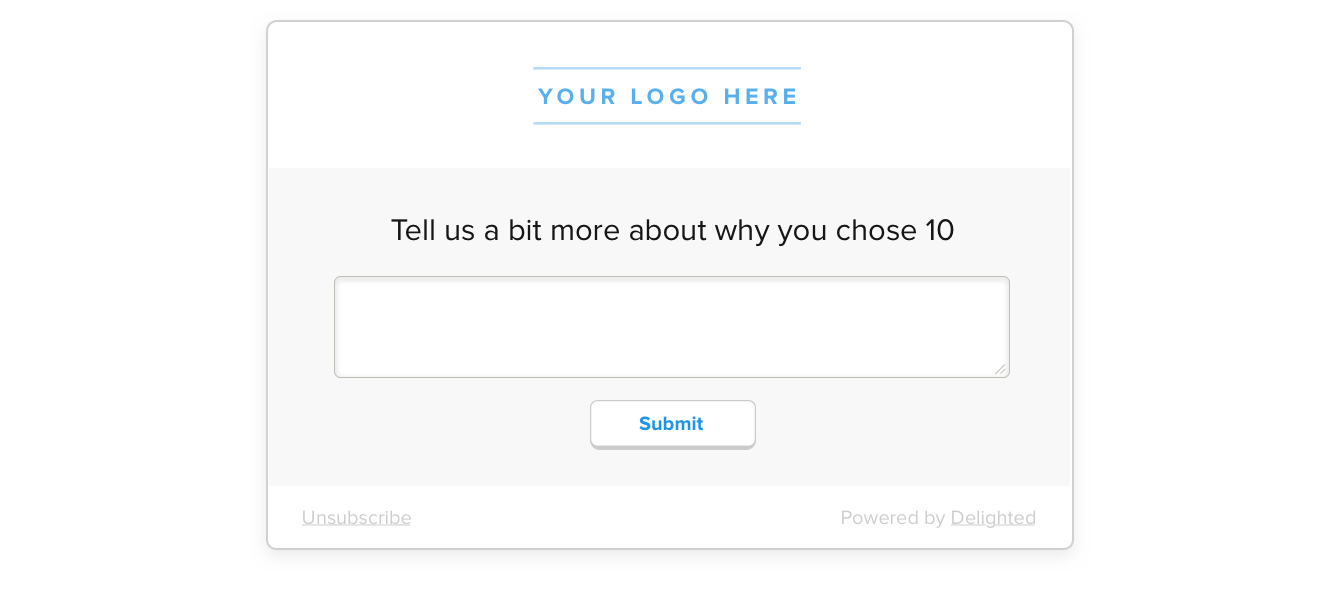
Open-ended questions and free response questions
An open-ended or free response survey question gives the respondent freedom to describe their experience or score decision in their own words. The verbatim comments provided from open-ended questions can shed light on why your quantitative data improves or decreases over time.
TIP: When using open-ended questions, it’s important to think about which research type (qualitative or quantitative) will really give you the data you’re looking for.
For example, if you simply want to learn about customer preferences, it may be best to get specific about the selection options in a multiple select question instead of an open-ended question to avoid obscure or a wide range of answers that will be difficult to quantify. That’s why instead of choosing between qualitative and quantitative research, combining quantitative (multiple choice) and qualitative (“other” option) can be beneficial.
Get started now with Delighted
As you can see, it’s not really a question of qualitative vs. quantitative data – it’s a blend of both that give you real audience insights.
Fortunately, your data collection method doesn’t have to be complicated. Delighted’s self-serve free online survey maker is equipped with quantitative and qualitative survey options to help you make the most out of your data analysis research.