

Find out how your real-time NPS compares to competitors in 20 industries with Benchmarks, our newest in-platform report.
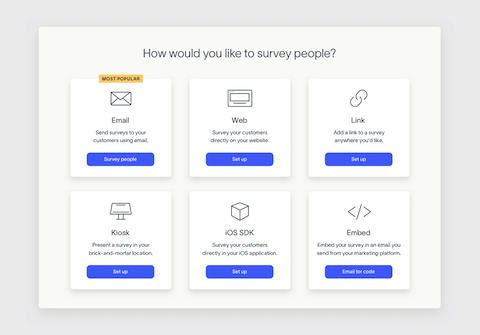
Prior to this release, our reporting features were all geared towards easy customer experience performance monitoring and feedback analysis for your Delighted survey results.
With this report, you’ll be able to get an external benchmark for how strong your customer experience is, in quick and simple Delighted fashion.
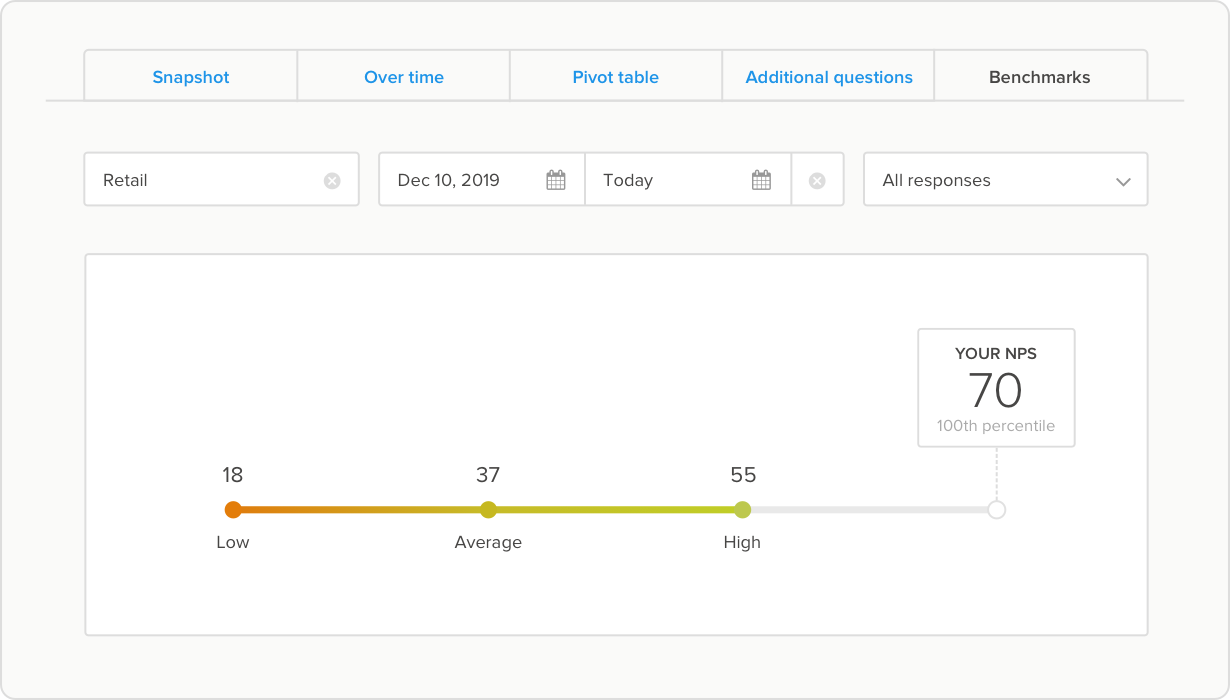
How the Benchmarks report works
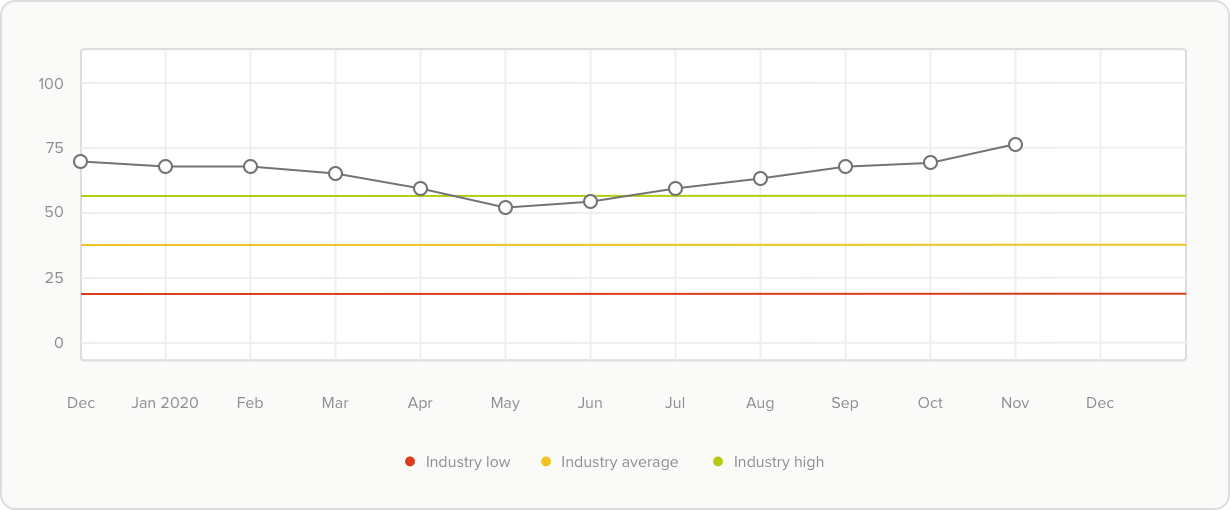
Compare your Net Promoter Score to the industry low, average, and high. The report will automatically pick an industry that it thinks is most closely aligned to your business, but you can compare yourself to any industry available through the dropdown menu. See what percentile you fall under, and adjust the date range or Trends filter to hone in on scores for a specific time frame or feedback theme. For more detailed information, check out our Help Center guide.
After seeing how you compare to your industry, skip over to the other reporting and analysis features at your disposal to investigate further.
What companies make up the benchmarks data?
The Net Promoter Scores used to compile these 20 industry benchmarks were independently sourced by the Qualtrics XM Institute (formerly Temkin Group). Over 10,000 consumers were polled on hundreds of companies to calculate these benchmarks.
The companies used to set the standard are all industry leaders, ranging from bluechip institutions in software like Apple and Microsoft, to retail incumbents like Walmart and Nordstrom.
Benchmarks does not use the scores of any Delighted customers to calculate industry averages. You’ll be able to see which companies are included in the benchmarks calculations within the report itself.
How Benchmarks helps you understand your NPS health
While there are multiple methods for understanding if your NPS is good or bad, external industry benchmarking gives you another way to contextualize your score. Include Benchmarks in your internal reporting for key stakeholders and specific departments to monitor how you’re tracking against your industry, and showcase your team’s CX achievements.
Benchmarks, along with the Pivot table and Additional Questions reports, are available on the Premium and Premium Plus ($224+/month) plans. To gain access to this comprehensive set of reporting tools, upgrade your account today.