
When you start setting up a customer experience program, one of the first things you’ll consider is how many customer surveys to send out.
This handy guide by Sean Mancillas, the head of our Customer Concierge Team, navigates you through statistics concepts like survey sample size and margin of error, equipping you to ballpark the survey and response volumes you’ll need for a best practice CX program.
Here are the fundamental terms to know:
Population size
The population size is the size of the entire community of people you wish to represent with the survey results.
Survey sample size
The batch of people who respond to your survey. Calculate your ideal sample size using our sample size calculator.
Sample size vs. population size
For Delighted customers with an extremely large customer base, it may not be completely practical to survey each and every person. However, taking a sample and factoring elements such as margin of error can help provide a statistically significant figure. Also, it’s worth noting that sample sizes stop increasing rapidly between 10-20k in volume. As a result, it isn’t necessary to survey all customers for larger companies (e.g. 100k customer base) to gain a statistically significant result, as the sample size will yield a very accurate result at volumes closer to 20k.
With Net Promoter Score, it is also worth noting that, in addition to getting a statistically significant result, another benefit is being able to close the loop with customers. We generally suggest reaching out to more than the suggested sample size so you can identify more passives and detractors, and turn around those experiences.
Margin of error
The margin of error will reveal the degree of error that surrounds any particular data point. This percentage indicates how likely the sample, including feedback and response behavior, is likely to deviate from the total population.
In general, the larger a sample size, the lower the margin of error. As a sample size grows closer to the size of the population, the results will become more and more representative and accurate. Sample sizes around 1000, for populations above 10000, are typically more than sufficient to provide a ±5% margin of error. Sample sizes won’t change much after this level
To better understand margin of error, consider this survey. An NPS survey was sent to 500 recent customers. Of those 500 customers, all responded and provided feedback. Of that total, 40% were Detractors. If we repeat this survey, using a 95% confidence level and ±5% margin of error, 95 times out of 100, the responses would be Detractors for between 35% and 45% of the total respondents.
Confidence level
A confidence level indicates the level of reliability regarding a measure. The most common confidence levels are 90%, 95%, and 99%.
A 95% confidence level means if the same survey were to be repeated 100 times under the same conditions, 95 times out of 100 the measure would lie somewhere within the margin of error.
When calculating the sample size (see Confidence intervals for NPS below), the z-score will be used to represent the confidence level. The z-score indicates the number of standard deviations a given proportion is away from the mean. Here’s a full breakdown:
- Confidence level (90%): Z-Score (1.65)
- Confidence level (95%): Z-Score (1.96)
- Confidence level (99%): Z-Score (2.58)
You can easily calculate what sample size you need, based on the confidence level and margin of error that you’re comfortable with, using this survey sample size calculator.
Response rate
As with any survey, a majority of customers will not respond to the survey they receive. As a result, when considering sample size, customers also need to factor in a response rate. You can take a look at our post on Delighted’s survey response rates by channel.
For estimation purposes, we recommend basing your calculations on a 10% response rate. For example, if we determined a sample size of 2,396, and an estimated response rate of 10%, the amount of people that would need to be surveyed for that sample size would be 23,960 people.
NPS and census
With a census survey strategy, as opposed to sampling, the focus is on aggregating feedback from 100% of a population. This is fairly common in B2B environments, where a regular pulse on all B2B relationships is extremely valuable.
Net Promoter Score’s methodology is particularly effective if targeting all customers, as well as tracking individual responses and their change over time.
With the census strategy, the most common approach is to contact all customers at a regular interval (ex. once every 90 days). This can be broken up in quarterly sends (ex. 1/90th of total customer population each day) or biannual sends (1/182th of total customer population each day). Avoiding reminders and over surveying can ensure there is a constant pulse of feedback being received without an uptick in unsubscribes.
Factoring in representation of important customer segments
To build actionability into your CX program, refine your population by segment. Consider who your most valuable customers are, who’s most active, what products they’re using, where they’re based. Who do you want to hear from most? New customers, returning customers?
Using Delighted’s properties, you can attach segmentation data with each survey request – making it easier to understand response volumes by different customer cohorts. This data, coupled with a better understanding of who you’re surveying and at what volume, will help paint a more complete picture of how this feedback represents the broader customer population.
Knowing who your program is scoped towards will make it easier to analyze feedback by segment, figure out where you might have gaps in representation, and prioritize action.
Non-responders
A major question that surrounds NPS is how to deal with non-responders. Those less apt to respond to surveys are typically those who are less active with a company, less likely to recommend, and overall less loyal.
In consideration of the big picture of customer loyalty and retention, non-responders can have a significant impact on business growth and success. Here are a few items to consider for reducing the degree of non-respondents:
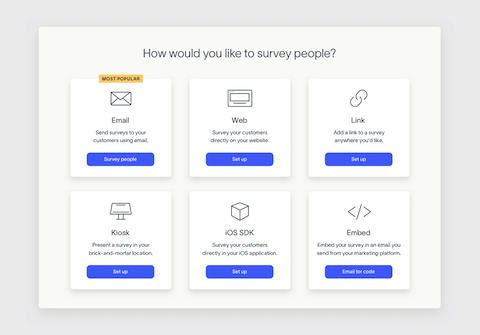
Make it easy
Ensure that the survey experience is simple and easy to complete in a timely manner. Customers may benefit from layering in an intro message, clarifying the short length of the survey, or sending a pre-dispatch broadcast that notifies customers of the upcoming survey and its ease of completion.
Develop a strong closed loop process
Customers don’t want to leave feedback if they feel it wouldn’t have an impact. Providing clear communication (whether in the follow-up or in more marketing/communication-based materials) that the response will be both individually addressed, as well as systematically applied, is a great way to convert more customers from non-responders into the responder group.
For example, here’s how Peloton demonstrated that they understood their delivery times were letting customers down, and how they vowed in front of their entire audience to address it:
For more guidance, head over to our post on minimizing nonresponse bias.
In addition to lessening the volume of non-responders, there are other methods customers apply for dealing with non-responders and nonresponse bias:
- Progressive Capture: Consider opting for platforms that collect feedback progressively versus requiring full survey completion. Delighted offers progressive capture to register the core NPS (or other metric) score as soon as it’s clicked – regardless if a follow-up comment is provided. While a majority of customers will engage the full survey, it’s important to account for those who are a bit more short on time – counting their feedback towards the overarching metric calculation.
- Bucketing Non-Responders: Bain & Company advocates for an approach which would be pulling data related to response rates, determining the volume of non-responders, and then splitting that segment into passives and/or detractors. For example, Fred Reichheld, the creator of NPS, suggested: “scoring all nonresponders as detractors (probably not too far off in business-to-business settings) or as a 50-50 mix of passives and detractors (a reasonable estimate for many consumer businesses).”
- Comparing Segments: Many customers will review the metadata associated with those who responded and cross-check that with the metadata for those who did not respond. From there, you can determine: 1) If there are instances of nonresponse bias (i.e. if there is a significant difference in response rate and response quality, such as score and comment, based on different customer segments) and 2) What actions would be needed to account for the nonresponse bias (e.g. the above bucketing method).
Ready to start collecting customer feedback? See how easy it can be with our experience management software, Delighted.